Figures & data
Table 1 Answers to the ESP
Table 2 SLEEP-50 subscale scores for participants who score positive (>2) and negative (≤2) on the ESP
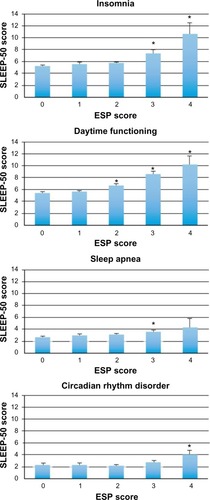
Figure 1 Relationship between SLEEP-50 scores and ESP scores.
Notes: Mean (SD) SLEEP-50 scores are shown for groups of people with different ESP scores (0–4). An ESP score >2 is a positive screen for having eating disorders and warrants further investigation of the subject. Significant differences from the group with an ESP score of zero (P<0.05) are indicated by *.
Abbreviations: ESP, Eating Disorder Screen for Primary Care; SD, standard deviation.
Abbreviations: ESP, Eating Disorder Screen for Primary Care; SD, standard deviation.