Figures & data
Table 1 The sampling dates, mean calf ages, and number of calves sampled according to test
Table 2 Nasal discharge and cough scoring criteria
Table 3 Mean ± SD values obtained from calves that had not been treated for respiratory disease prior to the test and had a cough score of 1 (neither spontaneous nor induced cough)
Figure 1 Alveolar-arterial oxygen pressure gradient in calves by age.
Notes: Dots represent estimated values; Values less than 0 mmHg are physiologically impossible and indicate measurement error; The respiratory quotient used was most likely unsuitable for older calves; The dashed line represents predicted alveolar-arterial oxygen (mmHg) =24.6 − 0.16*age + 0.0004*age2.
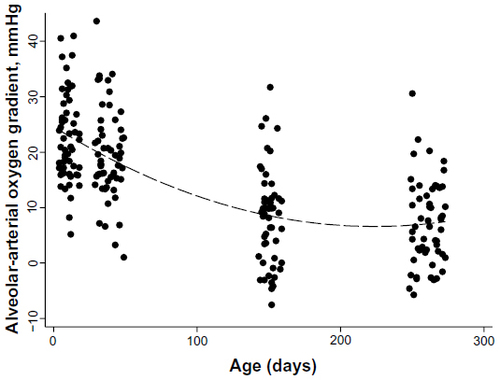
Figure 2 Arterial oxygen tension in calves by age.
Notes: Dots represent measured values; Dashed line represents predicted arterial oxygen tension fitted values (mmHg) =56.10 + 0.16*age − 0.0003*age2.
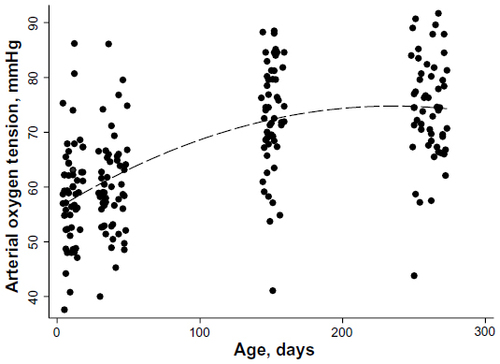
Table 4 The number of calves according to the number of treatments received for respiratory disease and age of first treatment
Figure 3 Percentage of calves with nasal scores 1 to 4 during test periods 1 to 4.
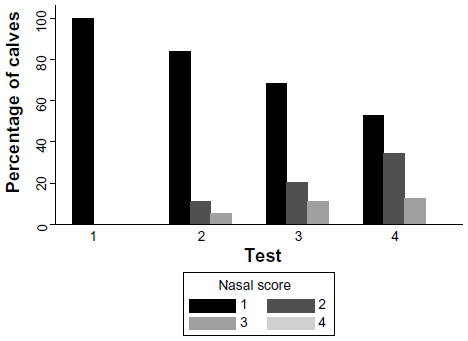
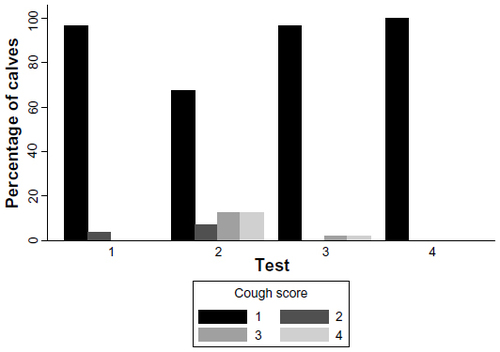
Figure 4 Percentage of calves with cough scores 1 to 4 during test periods 1 to 4.