Figures & data
Table 1 Feed and nutrients intake/head of both experimental diets
Table 2 Chemical composition and nutritive value of offered feeds used in ration formulation
Figure 1 Mean number of small, medium, large follicles and corpora lutae in control and restricted ewes.
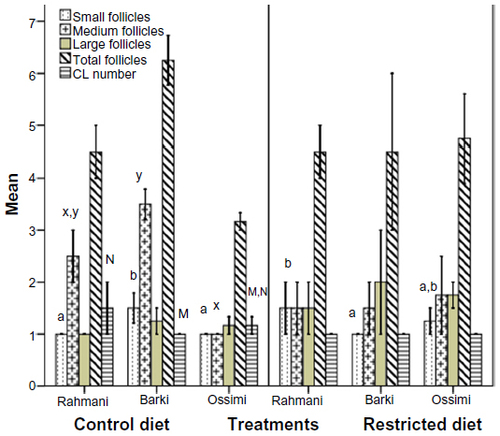
Table 3 Ovarian DF and CL diameters in diet-restricted and control ewes
Table 4 General linear model of effects of breed, treatment, and treatment * breed on ovarian follicles, antioxidants, body weight change, and glucose levels in fat-tailed ewes
Figure 2 Initial BW, final BW, BWC/kg (final BW – initial BW), and BWC% (BWC/initial BW × 100) in control and diet-restricted Barki, Rahmani, and Ossimi ewes.
Abbreviations: BW, body weight; BWC, body weight change.
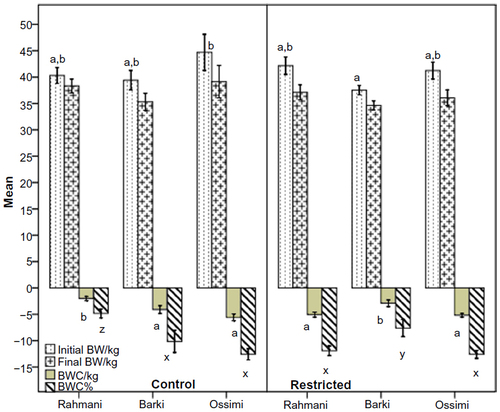
Figure 3 Insulin levels (μIU/mL) in control and diet-restricted Barki, Rahmani, and Ossimi ewes.
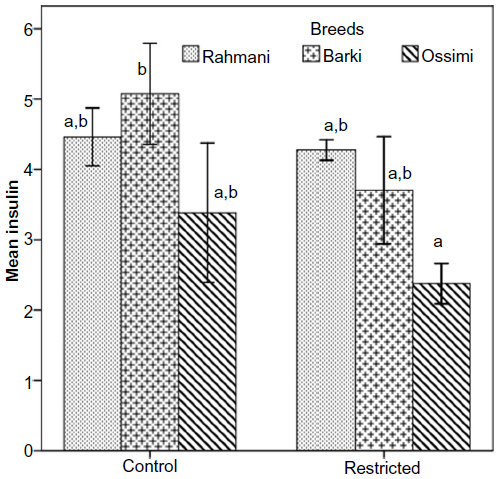
Figure 4 Glucose levels in control and diet-restricted Barki, Rahmani, and Ossimi ewes.
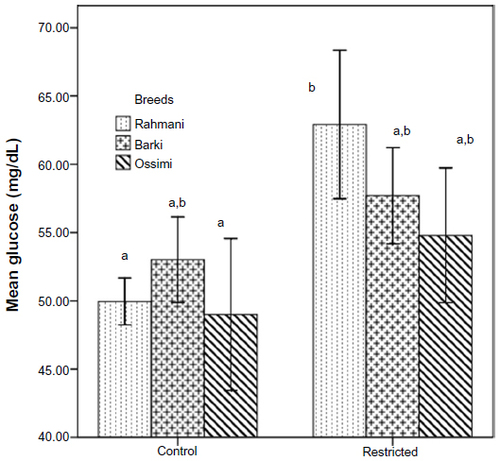
Figure 5 Total cholesterol levels in control and diet-restricted Barki, Rahmani, and Ossimi ewes.
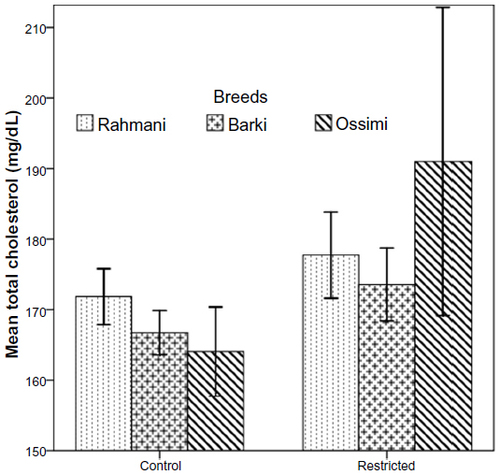
Figure 6 Total antioxidant capacity in control and diet-restricted Barki, Rahmani, and Ossimi ewes.
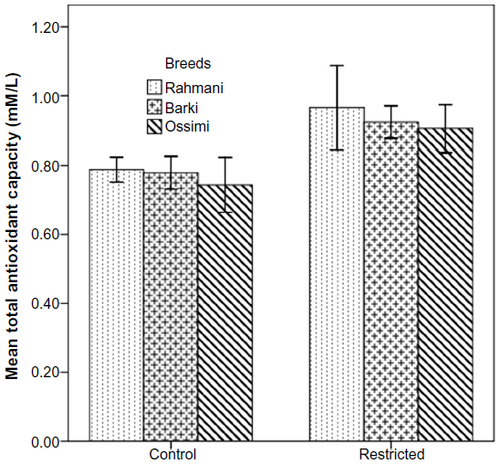
Figure 7 Superoxide dismutase (SOD) levels in control and diet-restricted Barki, Rahmani, and Ossimi ewes.
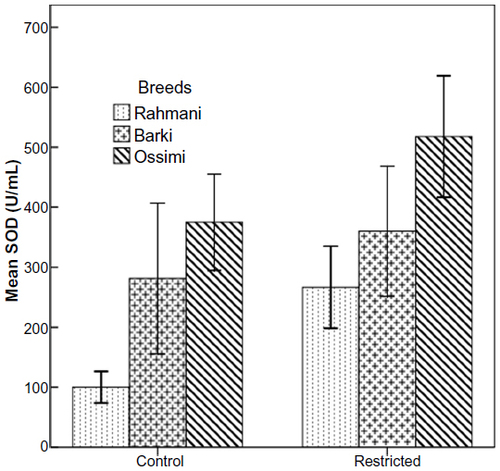
Figure 8 Lactate dehydrogenase (LDH) levels in control and diet-restricted Barki, Rahmani, and Ossimi ewes.
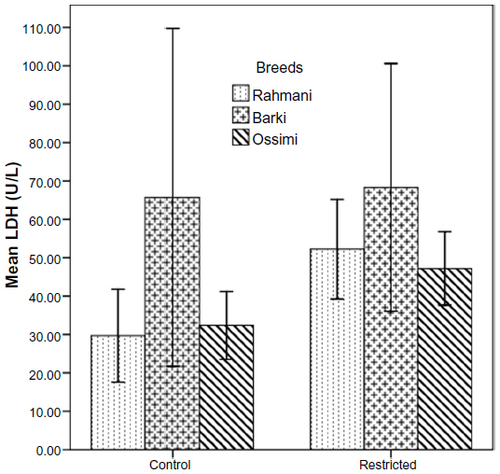
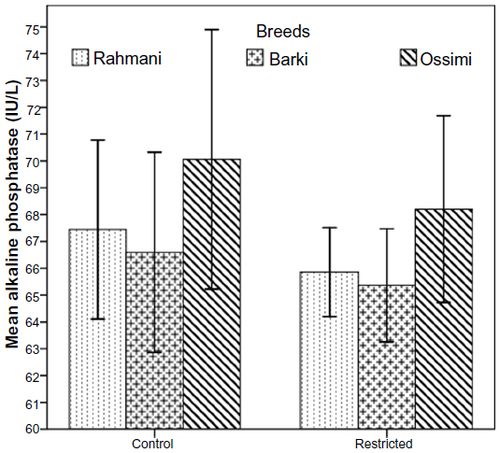
Figure 9 Alkaline phosphatase levels in control and diet-restricted Barki, Rahmani, and Ossimi ewes.