Figures & data
Figure 1 (A) Percentage of NFBs removed after one, two or three tries: 2012ߝ2016. (B) Proportion of symptom types. (C) Types of NFBs.
Abbreviation: NFBs, nasal foreign bodies.
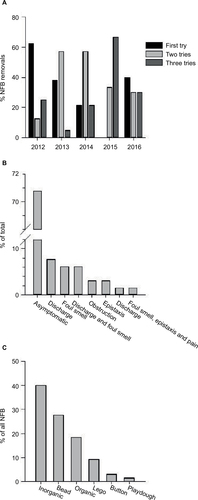
Table 1 Number and percentage of patients who had one, two or three attempts to remove NFBs, 2012–2016
Figure 2 (A) From left to right: Co-phenylcaine™ Forte Spray, Killian nasal speculum and head light. (B) Correct way of cuddling child when removing NFBs. (C) Medical personnelߣs hands resting on the childߣs face while attempting removal of NFBs.
Abbreviation: NFBs, nasal foreign bodies.
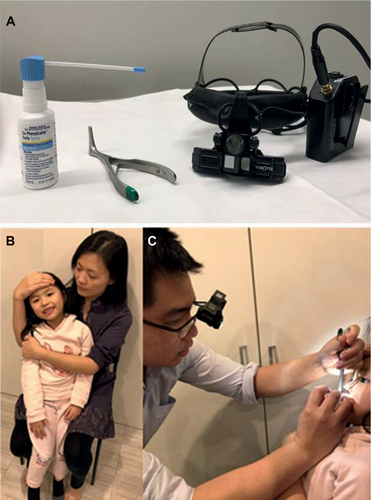
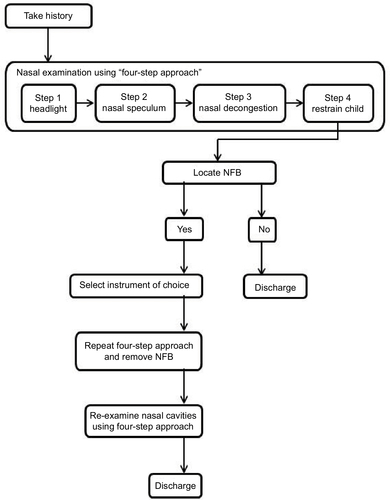
Figure 3 Flow chart for the “four-step approach” in removing NFBs.
Abbreviation: NFBs, nasal foreign bodies.