
Figures & data
Table 1 Demographic, clinical, and outcome data
Figure 1 Trauma by violence (n=45) or traffic accidents (n=87): region (site) of the body affected, according to the type of trauma. The total percent of each type of trauma can be higher than 100%.
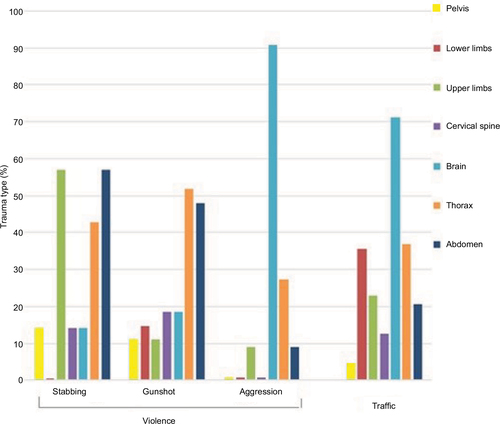
Table 2 Differences between deaths and survivors among patients with trauma by traffic accidents (n=87) and violence (n=45)
Table 3 Parameters obtained through the application of logistic regression to find the factors associated with the death of patients with trauma from traffic accidents (n=87)