
Figures & data
Table 1 Subject characteristics
Table 2 Spearman’s correlation analysis between BIS numbers and GCS score
Figure 1 Scatter plot distribution between GOS-E and BIS.
Abbreviations: BIS, bispectral index; GOS-E, Glasgow Outcome Scale-Extended.
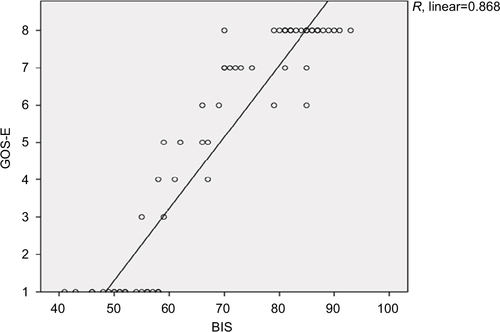
Table 3 Linear regression analysis relationship between GOS-E and BIS