
Figures & data
Table 1 Characteristics of the Surf Lifeguards and Nurse Anesthetists Included in the Study. Data are Presented as Median (Q1–Q3) or Number (Percentage)
Figure 1 Ventilations. (A) Time to first ventilation. Each dot represents a participant’s time to first ventilation. Data are median time to first ventilation with first and third quartile. Data on one surf lifeguard are missing. (B) Tidal volume. Each dot represents a participant’s mean tidal volume. Data are mean tidal volume with standard deviations. The gray area marks the recommended tidal volume by the ERC (0.5–0.6 L).
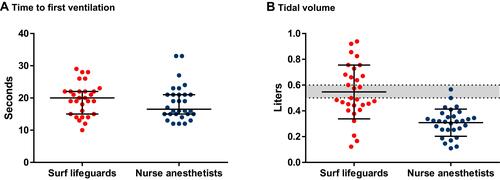
Table 2 Surf Lifeguard Rating of Own Skills Using the SGA. Data are Presented as Number (Percentage)