
Figures & data
Table 1 Comparison of Demographic Characteristics Among Subjects with Suspect CAP by CRB-65 Risk Score
Figure 1 Monthly trends with the respective regression line for the proportion of patients with low risk admitted to the hospitals from November 2015 to January 2018*.
Notes: *The denominator for the proportion is the total number of patients assigned as low-risk CURB-65 in the emergency department. The regression line was derived from a linear model.
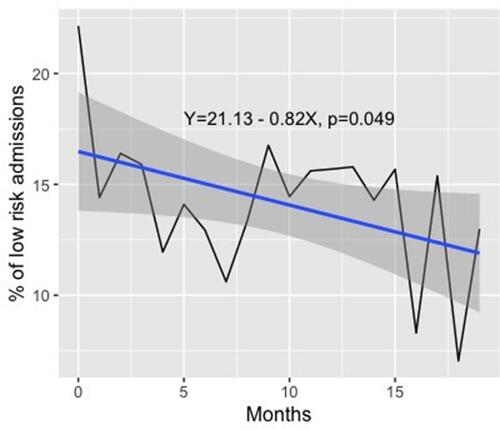
Table 2 Comparison of Clinical and Laboratory Characteristics Among Participants with Suspected CAP That Were Admitted to the Hospitals According to 30-Day Mortality
Table 3 Final Logistic Regression Model for the Prediction of 30-Day Mortality in Patients Admitted with Suspected CAP
Table 4 Clinical and Laboratory Variables Associated with Hospital Readmission Among the Low-Risk Admitted CAP Patients