
Figures & data
Figure 1 Infographic sketching.
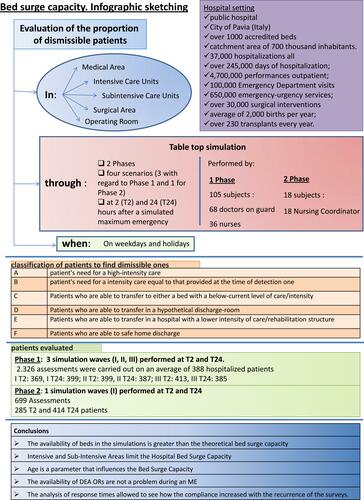
Table 1 Subjects Involved in the Fase 1 of the Study Divided by Area
Table 2 The Six Categories A, B, C, D, E and F in Which Hospitalized Patients Have Been Stratified are Arranged in a Decreasing Order of Care Intensity in the Our Areas of Interest (Medical, Surgery, Bubintensive Care, Intensive Care)
Table 3 The Five Categories I, II, III, IV, V in Which Patients Who Have to Undergo Surgery Have Been Stratified are Arranged in a Decreasing Order of the Possible Deferral of Surgery
Table 4 Association Between the Proportion of Dismissible Beds and the Area: Results of the Logistic Regression Model (Intensive Care Units Set as the Reference), Globally for All the Simulation Waves
Table 5 Subjects Involved in the Fase 2 of the Study Divided by Area
Table 6 Association Between the Proportion of Dismissible Beds and the Area Globally for All the Simulation Waves: All the Comparisons Between the Four Areas Analyzed are Reported
Table 7 Association Between the Proportion of Dismissible Beds and the Area: Results of the Logistic Regression Model (Intensive Care Units Set as the Reference), Distinctly for Simulation Waves
Table 8 Association Between Proportion of Dismissible Beds and Unit at 2 Hours After Simulated Maxiemergency Assessment: Results of the Logistic Regression Model (Intensive Care Units Set as the Reference), Globally for All the Simulation Waves
Table 9 Association Between the Proportion of Dismissible Beds and the Unit Globally for All the Simulation Waves: All the Comparisons are Reported
Table 10 Association Between the Proportion of Dismissible Beds and the Unit Distinctly for Each Simulation Wave: Results of a Logistic Regression Models (Intensive Care Unit Set as Reference). a) First Simulation Wave; b) Second Simulation Wave; c) Third Simulation Wave
Table 11 Proportion of Not Dismissible and Dismissible Beds and ICD-10 Diagnostic Chapter
Table 12 Conclusions