
Figures & data
Table 1 Patients’ Socio-Demographic Characteristics of the Study Participants
Table 2 Distribution of Type of Poisoning Agent, Manner, and Reason for Poisoning
Figure 1 Overall distribution of poisoning cases by gender and age.
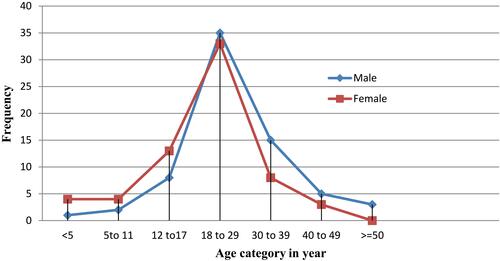
Figure 2 Overall distribution of chemicals contributed to poisoning by age.
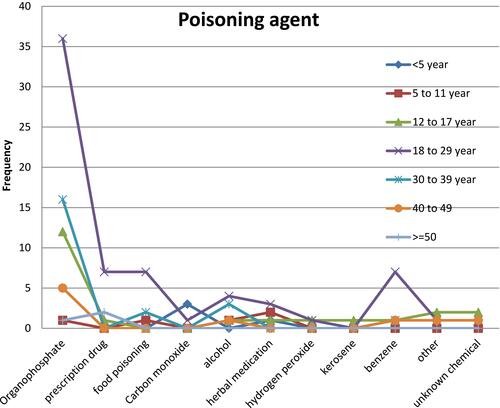
Figure 3 Distribution of manner or intension of poisoning by age and gender.
Notes: I_Female is intentional poisoning in females; Un_female is unintentional poisoning in females and vice versa.
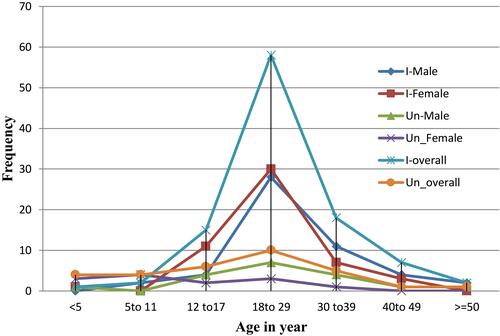
Table 3 Acute Poisoning Management Practice and Its Outcome
Figure 4 Time of arrival to the hospital since poisoning versus treatment outcome and length of hospital stay.
Abbreviations: Rx, treatment; LOS, length of hospital stay.
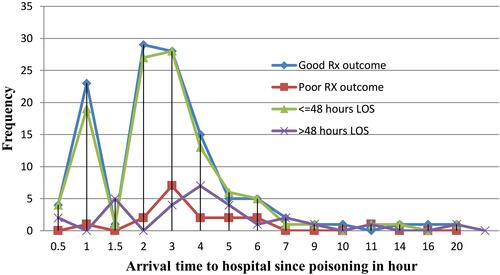
Table 4 Independent Predictors for Treatment Outcome of Acute Poisoning