
Figures & data
Table 1 Baseline Characteristics of the Patients
Figure 1 Consort flow diagram of trial.
Notes: Adapted from: Schulz KF, Altman DG, Moher D; CONSORT Group. CONSORT 2010 Statement: Updated Guidelines for Reporting Parallel Group Randomised Trials. PLoS Med. 2010;7(3):e1000251.Citation22 Copyright: © 2010 Schulz et al. Creative Commons Attribution License.
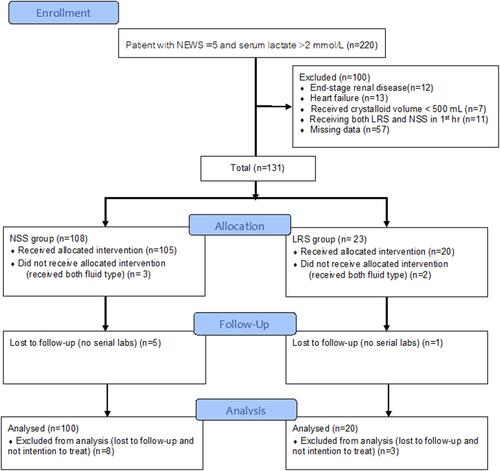
Table 2 Comparison of Isotonic Crystalloid Fluids in Septic Patients in the Emergency Department
Figure 2 Percentage of serum lactate change after intravenous fluid resuscitation in septic patients.
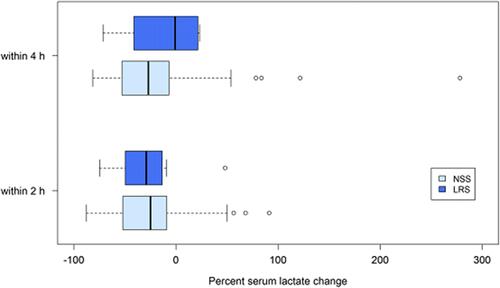
Figure 3 Serum creatinine level after fluid resuscitation in septic patients. *P<0.05.
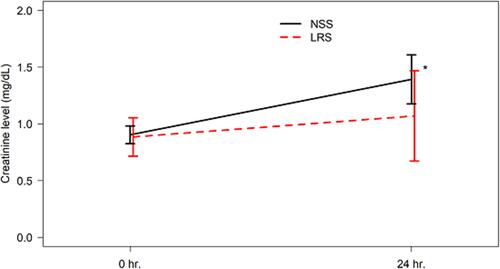
Table 3 Comparison of the Increased and Decreased Lactate Groups
Table 4 Multivariate Analysis by Logistic Regression; if Isotonic Crystalloid Solution Results in Increasing versus Decreasing Serum Lactate Levels