
Figures & data
Table 1 Summary Statistics of Out-of-Hospital Cardiac Arrest and Basic Life Support Course Participation in Denmark, from 2016 to 2019
Figure 1 Modified Consort Flow Diagram.
Notes: *Daytime – working hours is defined as 08.00–16.00. Night-time – out of offices hours is defined as 16.00–08.00. CONSORT figure adapted from Falci SGM, Marques LS. CONSORT: when and how to use it. Dental Press J. Orthod. 2015;20(3):13-15. Copyright: © 2015 Falci and Marques. Creative Commons Attribution License.Citation35
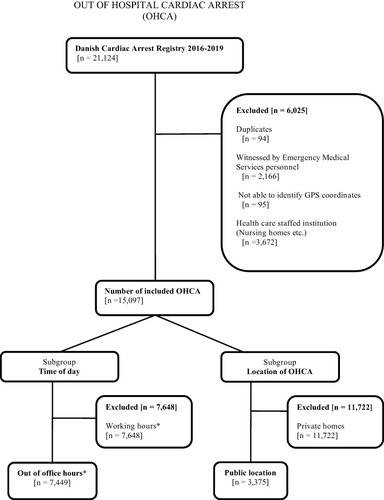
Figure 2 Incidence proportion of number OHCAs per 100,000 inhabitants, 30-day survival BLS course participation rates and bystander rates at OHCA in Denmark at municipal level from January 1 2016 to December 31 2019.
Notes: Incidence proportion (%) between 2016 and 2019 of (a). Out-of-hospital cardiac arrest per 100,000 inhabitants; (b). 30-day survival from out-of-hospital cardiac arrest; (c). Basic life support course participation rate; (d). Rates of bystander cardio pulmonary resuscitation at out-of-hospital cardiac arrest at municipal level, in Denmark from January 1 2016 to December 31 2019.
Abbreviations: CPR, cardiopulmonary resuscitation; BLS, basic life support; OHCA, out-of-hospital cardiac arrests.
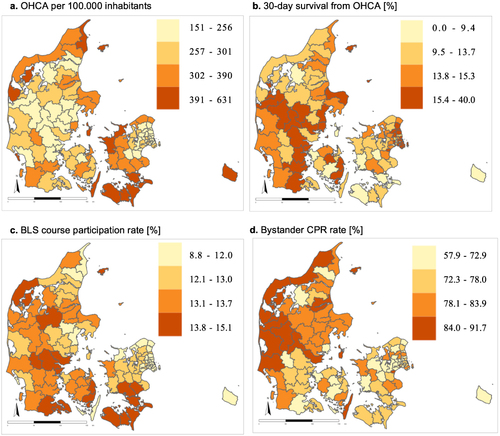
Table 2 Global Moran’s I Summary Statistics
Figure 3 Map of significant geographical clusters of (a) number OHCA per 100,000 inhabitants; (b) 30-day survival; (c) BLS course participation rates and (d) bystander CPR rates at OHCA at municipal level from 2016 to 2019.
Notes: High-High [red]: Indicates a significant geographical cluster within the municipality with high value in the municipality and high value in a municipality next to it (neighboring), not to be expected by chance. Low-Low [blue]: Indicates a significant geographical cluster within the municipality with low value in the municipality and low value in a municipality next to it (neighboring), not to be expected by chance. Low-High [light red]: Indicates a significant geographical cluster within the municipality with low value in the municipality and high value in a municipality next to it (neighboring), not to be expected by chance. Low-High [light blue]: Indicates a significant geographical cluster within the municipality with high value in the municipality and high value in a municipality next to it (neighboring), not to be expected by chance.
Abbreviations: CPR, cardiopulmonary resuscitation; BLS, basic life support; OHCA, out-of-hospital cardiac arrest.
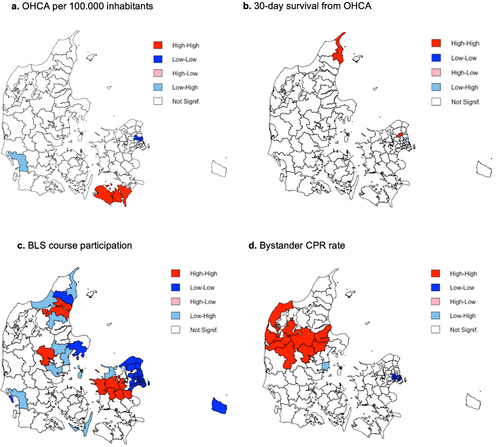
Table 3 Odds Ratios and Summary Statistics from Non-Spatial and Spatial Analysis