Figures & data
Table 1 Baseline Clinical Characteristics of Patient Categorized into Two Groups with and without Biliary Drainage
Figure 1 Estimated overall survival rates for patients categorized into two groups with and without biliary drainage.
Notes: An orange line and a black line show survival curve for patients treated with biliary drainage (n = 45) and without drainage (n = 26), respectively. Log rank test resulted that there was no significant difference between two groups (P = 0.533).
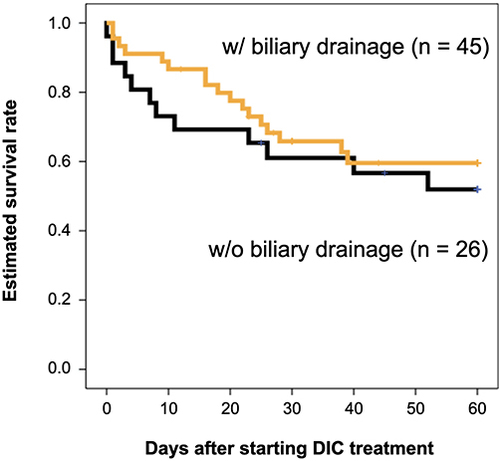
Figure 2 Estimated overall survival rates for patients with biliary drainage.
Notes: A blue and a green line show survival curve for patients treated by rTM preparation (n = 35) and AT replacement therapy (n = 10), respectively. There was no statistically significant difference between rTM preparation and AT replacement therapy in the 60-day OS (P = 0.219).
Abbreviations: rTM, recombinant thrombomodulin; AT, antithrombin; OS, overall survival.
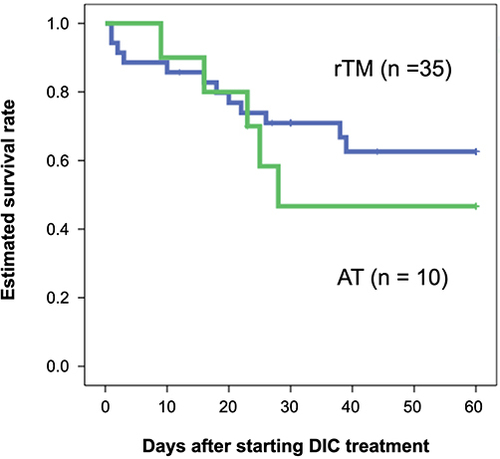
Figure 3 Estimated overall survival rates for patients without biliary drainage.
Notes: A blue and a green line show survival curve for patients treated by rTM preparation (n = 19) and AT replacement therapy (n = 7), respectively. There was a statistically significant difference between rTM preparation and AT replacement therapy in the 60-day OS (P = 0.011).
Abbreviations: rTM, recombinant thrombomodulin; AT, antithrombin; OS, overall survival.
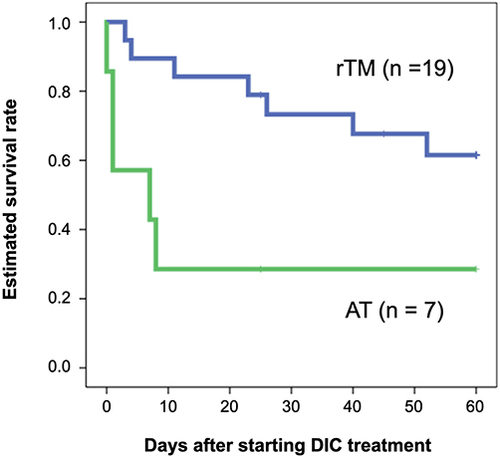
Table 2 Clinical Characteristics of Patient’s Background Data of the rTM Preparation and at Replacement Therapy Group
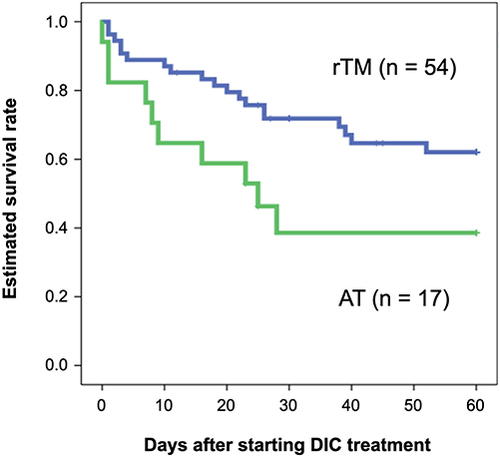
Figure 4 Estimated overall survival rates for patients with cholangitis-associated DIC treated by rTM preparation or AT replacement therapy.
Notes: A blue and a green line show survival curve for patients treated by rTM preparation (n = 54) and AT replacement therapy (n = 17), respectively. There was a statistically significant difference between rTM preparation and AT replacement therapy in the 60-day OS (P = 0.022).
Abbreviations: DIC, disseminated intravascular coagulation; rTM, recombinant thrombomodulin; AT, antithrombin; OS, overall survival.