Figures & data
Table 1 Descriptive Statistics for Collapse Witnesses, Places of Collapse, Recognition of Cardiac Arrest and CPR Instructions via Emergency Call. All Values are Expressed as Counts with (Percentages)
Table 2 Bystander CPR, and Type of CPR – According to the Place of Collapse, Dispatcher Instructions for CPR (for Cases Where Cardiac Arrest Occurred Before the Initial Call to the Emergency Medical Service), ROSC Status and Outcome. All Values are Expressed as Counts
Table 3 Binary Logistic Regression for Predicting ROSC Maintenance at the Hospital Admission with the Following Covariates
Table 4 Differences in EMS Response Intervals, Bystander Reaction Intervals, and Age in Cases Where ROSC Was and Was Not Maintained Until the Hospital Admission
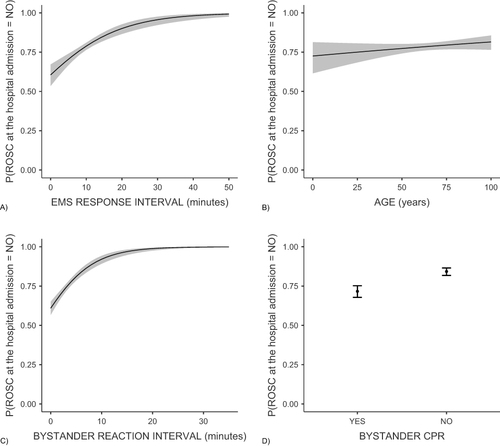
Figure 1 Binary logistic regression model for maintained ROSC at the hospital admission. (A) association of EMS response interval and maintained ROSC at the hospital admission (B) association of patients’ age and maintained ROSC at the hospital admission (C) association of bystander reaction interval and maintained ROSC at the hospital admission (D) association of bystander CPR and maintained ROSC at the hospital admission.