
Figures & data
Figure 1 A phylogenetic tree for NDUFS8 orthologs.
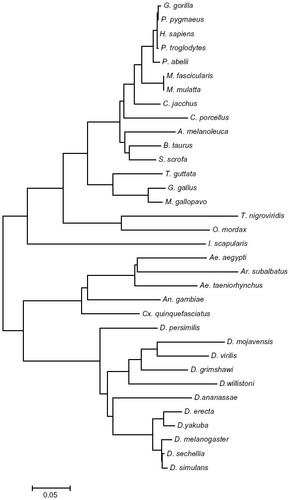
Figure 2 AetNDUFS8 mRNA expression levels in eggs, larvae, pupae, and adults quantified by qPCR, with SD for three replicates.
Abbreviations: d, day; h, hours; mRNA, messenger RNA, qPCR, quantitative real-time polymerase chain reaction; SD, standard deviation.
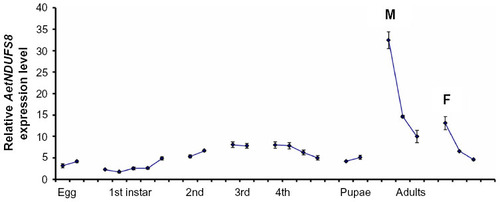
Figure 3 AetNDUFS8 mRNA expression levels in 5 d old female treated topically with permethrin/acetone at 2.5×10⁻⁵ μg (high dose, HD), and 1.25×10⁻⁵ μg (low dose, LD) per mosquito, and acetone (Ac) quantified by qPCR, with standard deviation (SD) for three replicates. Please note X-axis is not to scale. Five-day-old adult postexposure to permethrin at 0, 5, 15, 30, 60, 180, and 360 min, and 24 h.
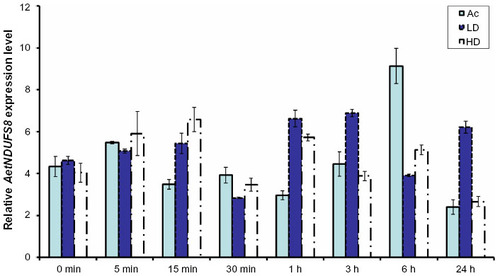
Figure 4 AetNADH5 mRNA expression levels in eggs, larvae, pupae, and adults quantified by qPCR, with SD for three replicates.
Abbreviations: d, day; h, hours; mRNA, messenger RNA; qPCR, quantitative real-time polymerase chain reaction; SD, standard deviation.
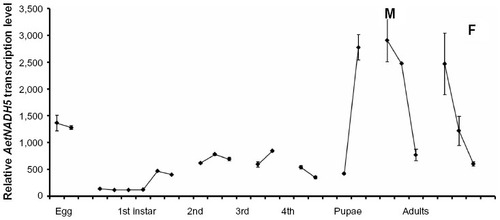
Table S1 Expression of AetNDUFS8 in different developmental stages of Aedes taeniorhynchus
Table S2 Paired t-test data for comparison of relative AetNDUFS8 gene transcription between female (F) and male (M), as well as different ages between the same sex (either female or male) in Aedes taeniorhynchus
Table S3 Paired t-test data for comparison of relative AetNDUFS8 gene transcription between eggs, larvae, pupae, and adults in Aedes taeniorhynchus
Table S4 Expression of AetNDUFS8 under permethrin stress conditions in Aedes taeniorhynchus
Table S5 Paired t-test data for comparison of relative AetNDUFS8 gene transcription between acetone, low dose (LD), and high dose (HD) permethrin treatments in Aedes taeniorhynchus
Table S6 Expression of AetNADH5 in different developmental stages of Aedes taeniorhynchus
Table S7 Paired t-test data for comparison of relative AetNADH5 gene transcription between female (F) and male (M), as well as different ages between the same sex (either female or male) in Aedes taeniorhynchus
Table S8 Paired t-test data for comparison of relative AetNADH5 gene transcription between eggs, larvae, pupae, and adults in Aedes taeniorhynchus