
Figures & data
Figure 1 (A) Subject disposition, study 1; (B) subject disposition, study 2.
Abbreviations: ITT, intent to treat; AE, adverse event.
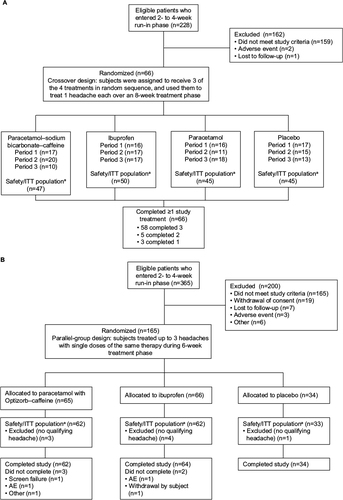
Table 1 Demographics and baseline characteristics, study 1, safety/ITT population
Table 2 Demographics and baseline characteristics for study 2, safety/ITT population
Figure 2 Time to perceptible pain relief (primary outcome), Kaplan–Meier curve, study 1, intent-to-treat population.
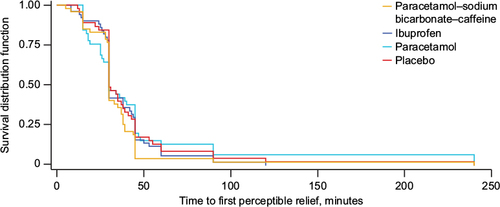
Figure 3 Adjusted mean SPID0–60, SPID0–90, SPID0–120, and SPID0–240 (secondary outcomes), study 1, ITT population.
Abbreviations: SPID, sum of pain-intensity difference (numeric subscript ranges indicate minutes); ITT, intent to treat; ANCOVA, analysis of covariance.
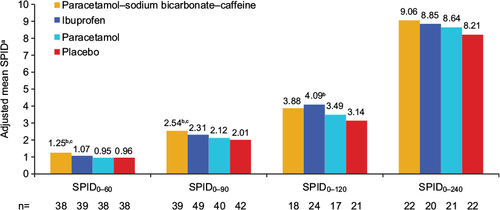
Figure 4 Adjusted mean TOTPAR (secondary outcome), study 1, ITT population.
Abbreviations: TOTPAR, total pain relief (numeric subscript ranges indicate minutes); ITT, intent to treat; ANCOVA, analysis of covariance.
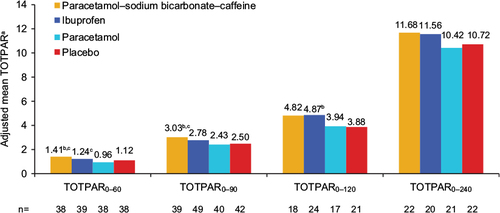
Table 3 Number of subjects with headache resolution and global impression of treatment (secondary efficacy outcomes), study 1, ITT population
Figure 5 Adjusted mean SPID0–1, SPID0–2, SPID0–3 (secondary outcomes), and SPID0–4 (primary outcome), study 2, ITT population.
Abbreviations: SPID, sum of pain-intensity difference (numeric subscript ranges indicate hours); ITT, intent to treat; ANCOVA, analysis of covariance; CI, confidence interval.
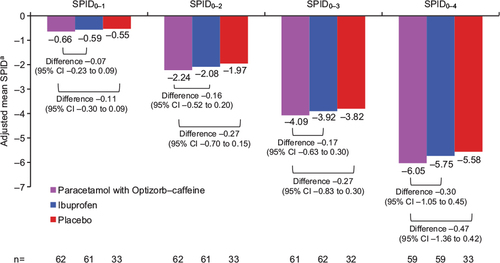
Figure 6 Adjusted mean TOTPAR0–1, TOTPAR0–2, TOTPAR0–3, and TOTPAR0–4 (secondary outcomes), study 2, ITT population.
Abbreviations: TOTPAR, total pain relief (numeric subscript ranges indicate hours); ITT, intent to treat; ANCOVA, analysis of covariance; CI, confidence interval.
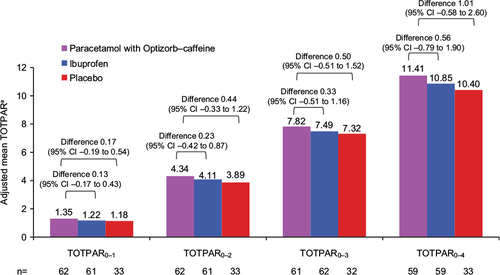
Figure 7 (A) Time to perceptible pain relief and (B) time to meaningful pain relief (both secondary outcomes), Kaplan–Meier curves, study 2, intent-to-treat population.
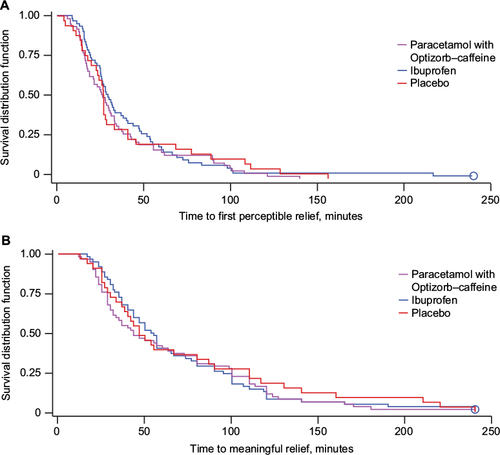
Table 4 Number of subjects with complete relief, global impression of treatment, and use of rescue medication (secondary efficacy outcomes), study 2, ITT population
Table 5 TEAEs in study 1, safety population
Table 6 TEAEs in study 2, safety population
Table S1 Additional secondary efficacy outcomes from study 1, ITT population