Figures & data
Figure 1 Simplified flow processes in the development of medicinal products and the corresponding process of publicly available information on the EMA website.
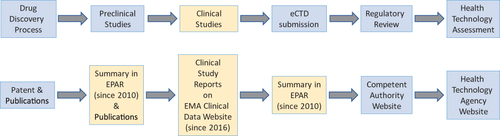
Table 1 Categories And Data Availability Of Clinical Development Pathways For Timeline Analysis
Figure 2 Comparison of document composition in the core and non-core CDPs. Percentage of clinical study reports according to the phase of clinical development.
Abbreviations: CDP, clinical development pathway; CSR, clinical study report; EMA, European Medicines Agency.
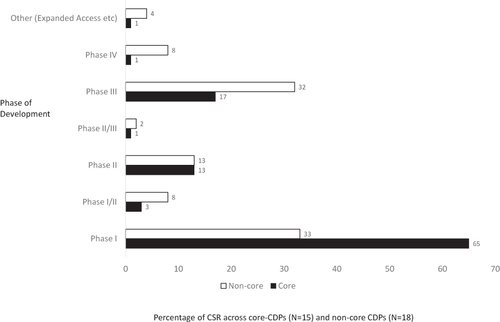
Figure 3 Clinical development documents available on the clinical data website of the EMA up to April 1, 2018.
Abbreviations: CDP, clinical development pathway; CSR, clinical study report; No, number.
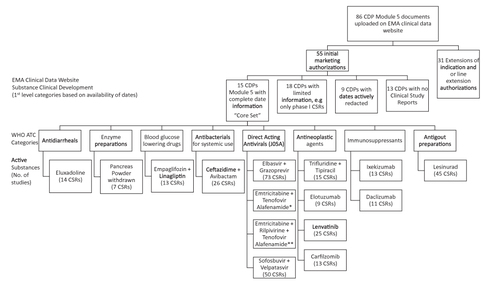
Table 2 CSR Categorization Based On The eCTD M.5.3 Leaf Structure And Phase Of Clinical Development - Core CDPs
Table 3 Clinical Development Observations With Respect To Timelines In Days (And Years)
Table 4 Project Evaluation And Review In Exploring CDP Critical Paths In Days (And Years)
Figure 4 GANTT chart of the clinical development of eluxadoline based on the FSI to LSO, according to phase and regulatory eCTD leaf structure with project timelines.
Abbreviations: CDP, clinical development pathway; DDI, drug–drug interaction; eCTD, electronic common technical document; FIH, first in human study; FIM, first in man study; FSI, first-subject-in; GANTT, generalized activity normalization time table; LSO, last-subject-out; PK, pharmacokinetic; QTc, thorough QT/QTc prolongation/QTc-like study.
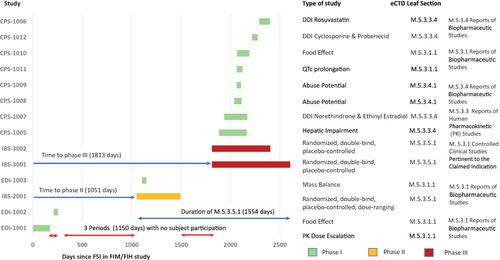
Figure 5 Network analysis of the lesinurad CDP based on an ICH E8 categorization and the FSI in each clinical study.
Abbreviations: ADME, absorption, distribution, metabolism and elimination study; BA, bioavailability study; CDP, clinical development pathway; CSR, clinical study report; eCTD, electronic common technical document; EMA, European Medicines Agency; ICH, International Council for Harmonisation of Technical Requirements for Pharmaceuticals for Human Use; FSI, first-subject-in; PK, pharmacokinetic; TQT, thorough QT/QTc prolongation/QTc-like study.
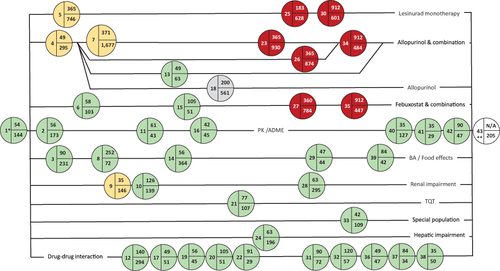
Figure 6 Pictogram of the lesinurad CDP with a focus on Phase I studies of special interest in relation to the initiation of enrolment to the Phase II and Phase III studies. The Phase IV study is only partially shown (prior to the QTc prolongation).
Abbreviations: (I) Phase I; (II) Phase II; (III) Phase III; (IV) Phase IV; CDP, clinical development pathway; CSR, clinical study report; EMA European Medicines Agency; FSI, first-subject-in; MB, mass balance study, PK, pharmacokinetic; QTc, thorough QT/QTc prolongation/QTc-like study.
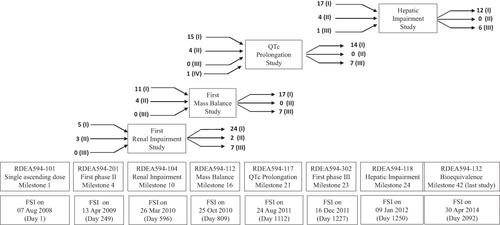
Table 5 Overview Of Specific Phase I Studies Or Measures That Have The Potential To Affect Clinical Development Timelines
Figure 7 A comparison of the lenvatinib [core CDP], rociletinib, and osimertinib [non-core CDPs] total subject recruitment times (based on the FSI to LSO) in the clinical study reports submitted and on the ECDW.
Abbreviations: CDP, clinical development pathway, eCTD, electronic common technical document, EMA, European Medicines Agency, FSI, first-subject-in, LSO, last-subject-out; TSRT, total subject recruitment times.
![Figure 7 A comparison of the lenvatinib [core CDP], rociletinib, and osimertinib [non-core CDPs] total subject recruitment times (based on the FSI to LSO) in the clinical study reports submitted and on the ECDW.](/cms/asset/5246b893-6b0f-405c-b8a1-b430339a4f18/djct_a_12191256_f0007_c.jpg)
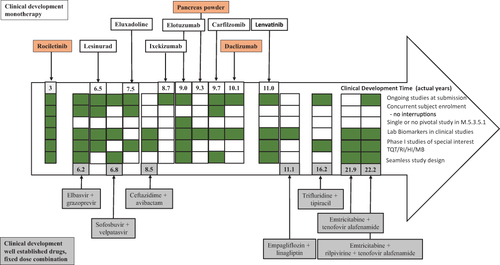
Figure 8 Overview of different strategies applied in the clinical development of the core CDPs (monotherapy and fixed-dose combination) compared with the shortest CDT, ie, rociletinib (non-core CDP, with breakthrough designation).
Abbreviations: CDP, clinical development pathway; HI, hepatic impairment study, MB, mass balance study; QTc, thorough QT/QTc prolongation/QTc-like study; RI, renal impairment study.