
Figures & data
Figure 1 Frontal plane projection angles.
Notes: (A) Method 1 established as the angulation exhibited by a line across ASIS, mid-patella, and the midpoint between both malleoli at the distal tibia. Vertical line represents zero degrees with counterclockwise movements of the lower fulcrum (knee to ankle line), representing valgus alignment for the left leg and clockwise movement for the right leg. (B) Method 2 established as the angulation exhibited by mid-patella and midpoint between both ankle malleoli. Motion started at zero in the vertical position with mid-patella to ankle fulcrum, representing valgus while moving clockwise for the right leg and counterclockwise for the left leg.
Abbreviation: ASIS, anterior superior iliac spine.
Abbreviation: ASIS, anterior superior iliac spine.
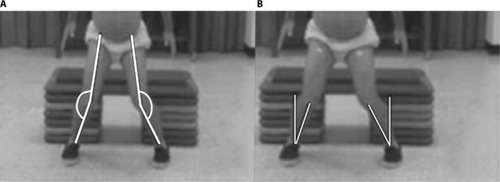
Figure 2 KASR defined as the ratio of distance between lateral femoral epicondyles (knee) and lateral malleoli (ankle) (KASR = knee/ankle) during peak knee flexion.
Abbreviation: KASR, knee-to-ankle separation ratio.
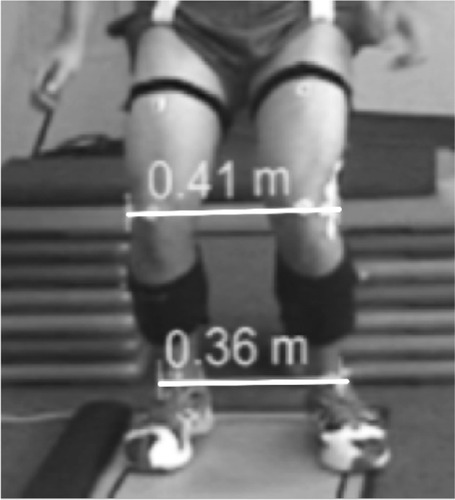
Figure 3 KSD quantified as the distance (in meters) between the right and left lateral femoral epicondyle markers between initial contact phase (A) and peak knee flexion (B).
Abbreviation: KSD, knee separation distance.
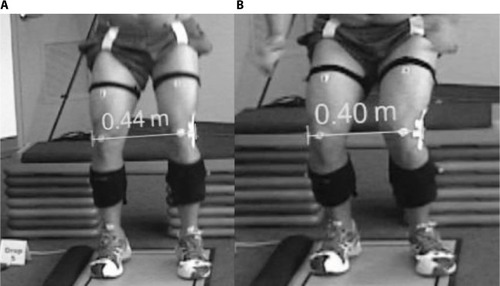
Table 1 Mean values for 2D and 3D variables during drop jumps
Table 2 Intrarater reliability of 2D FPPA, KASR, and KSD measures during drop jumps
Table 3 Interrater reliability for Dartfish™ measures and correlation between 2D and 3D FPPA, KASR, and KSD variables