
Figures & data
Table 1 Anthropometric data of the participants
Table 2 Detailed inclusion and exclusion criteria for this study
Figure 1 Schematic representation of the test protocol.
Note: Downward pointing arrows denote the time points when recovery characteristics were measured.
Abbreviations: DOMS, delayed-onset muscle soreness; PPO, peak power output; RPE, ratings of perceived exertion; VJP, vertical jump performance.
Abbreviations: DOMS, delayed-onset muscle soreness; PPO, peak power output; RPE, ratings of perceived exertion; VJP, vertical jump performance.
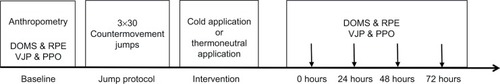
Figure 2 Change over time of DOMS and RPE for the groups.
Notes: The values are in median ± interquartile ranges. *Indicates a significant time effect (P<0.05). #Significantly different from baseline values within groups (P<0.05).
Abbreviations: DOMS, delayed-onset muscle soreness; RPE, ratings of perceived exertion; VAS, visual analog scale.
Abbreviations: DOMS, delayed-onset muscle soreness; RPE, ratings of perceived exertion; VAS, visual analog scale.
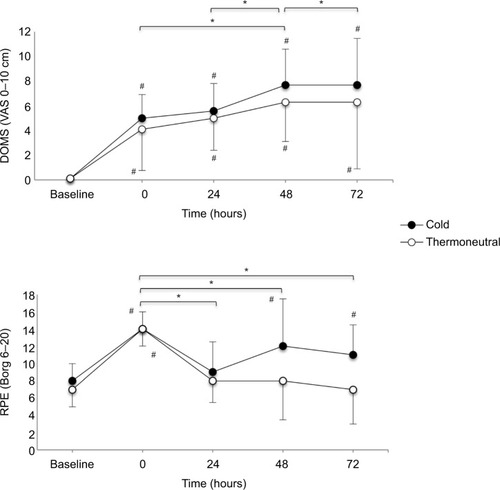
Figure 3 Change over time of VJP and PPO for the groups.
Notes: The values are provided as mean ± SD. *Indicates a significant time effect (P<0.05).
Abbreviations: PPO, peak power output; VJP, vertical jump performance; SD, standard deviation.
Abbreviations: PPO, peak power output; VJP, vertical jump performance; SD, standard deviation.
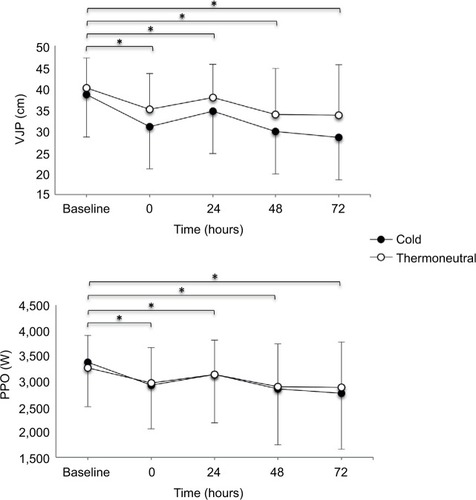
Table 3 Changes over time of subjective and objective recovery variables