
Figures & data
Table 1 Anthropometric data (mean ± SD) of participants according to sex
Figure 1 Traumatic and overuse injuries of the total sample, separated by sex (percentage of affected athletes of total sample).
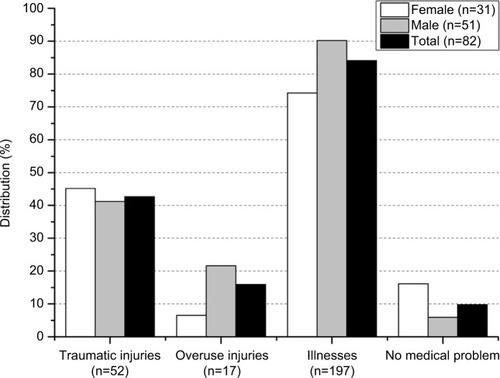
Figure 2 Severity of traumatic and overuse injuries as well as illnesses.
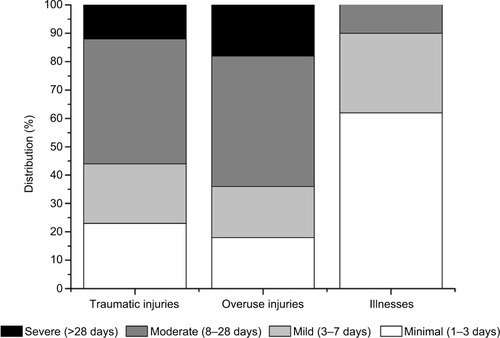
Figure 3 Traumatic injuries, overuse injuries, and illnesses separated by biological maturity status (percentages of affected athletes in each category).
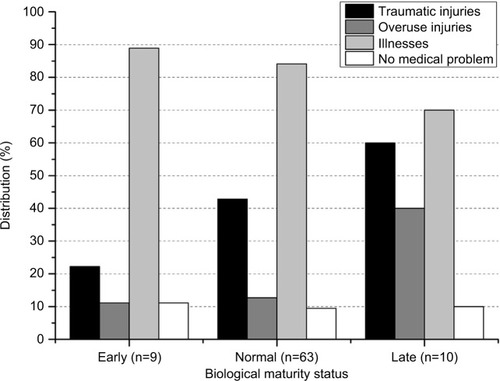
Figure 4 Traumatic injuries, overuse injuries, and illnesses separated by relative age quarter (percentage of affected athletes in each category).
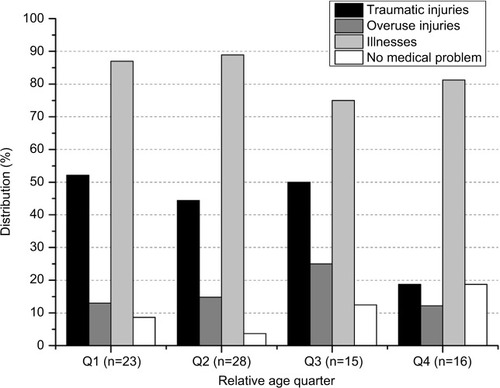
Table 2 Distribution of injury type and injured body part