
Figures & data
Table 1 Physiological characteristics of the n = 97 marathon runners
Table 2 Training and racing characteristics of the n = 82 marathon runners
Figure 1 Blood lactate responses to incremental treadmill exercise.
Note: ●, >4.5 h group; ▲, 4–4.5 h group; ■, 3.5–4 h group; ♦, 3–3.5 h group; X, 2.5–3 h group.
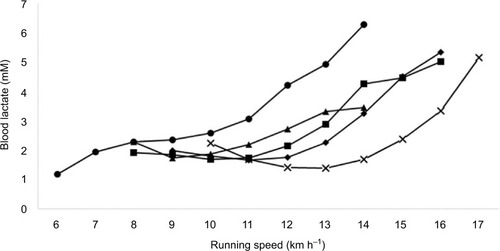
Figure 2 RE expressed as % during incremental treadmill exercise.
Note: ●, >4.5 h group; ▲, 4–4.5 h group; ■, 3.5–4 h group; ♦, 3–3.5 h group; X, 2.5–3 h group.
Abbreviation: RE, running economy.
Abbreviation: RE, running economy.
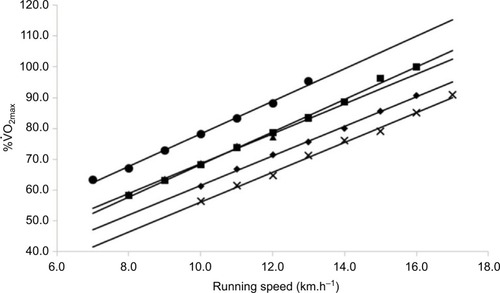
Table 3 Resting blood-based parameters of the n = 82 participants