Figures & data
Figure 1 Flow chart for search and selection of articles.
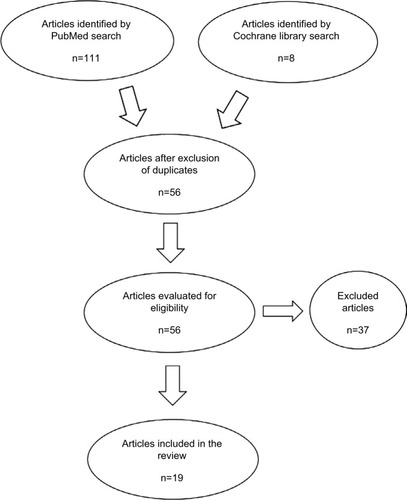
Table 1 Characteristics of selected studies
Table 2 Classification of levels of evidence
Table 3 Stages of osteitis pubis
Table 4 Differential diagnosis of groin pain
Figure 2 “Flamingo view” radiograph (obtained with the patient bearing weight alternately on each leg) that shows vertical pubic subluxation greater than 2 mm and underlying degenerative changes.
Note: A caudal osteolysis is visible on the right side (arrow).
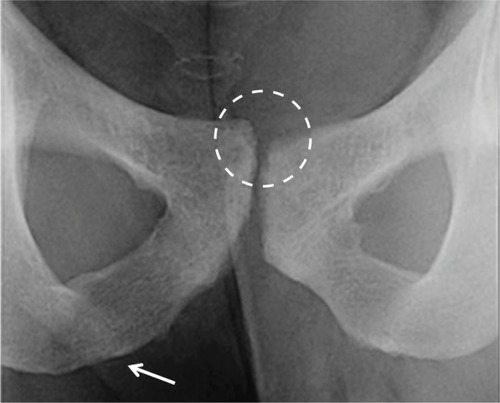
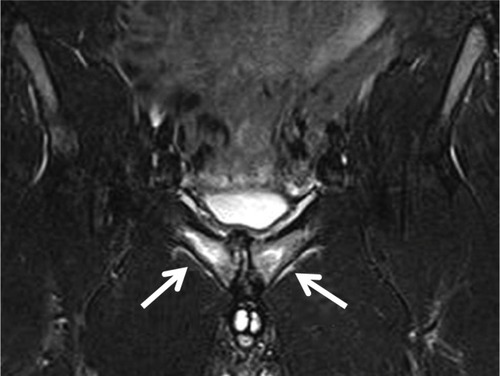
Figure 3 Coronal T2 fat suppression MRI image showing marked bilateral diffuse symphyseal bone marrow edema and parasymphyseal edema (arrows).