
Figures & data
Figure 1 Flowchart of the literature search and the selection process.
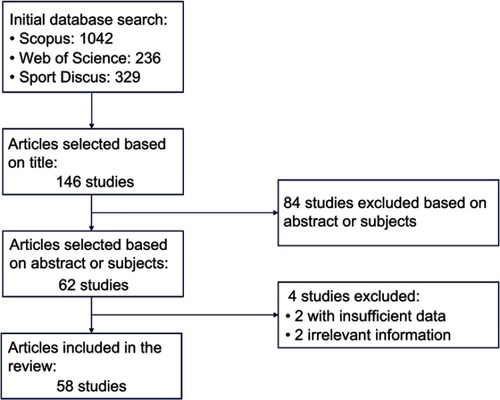
Table 1 TMG protocols used in scientific literature
Table 2 Characteristics of the studies that assessed specific muscle performance effects
Table 3 Tc, Dm, Vrn and Vc reference values in different sports modalities. Data are presented as mean (SD).
Figure 2 Algorithm implemented by the TMG-BMC tensomyography® software to determine the lateral (LS) and functional symmetry (FS).
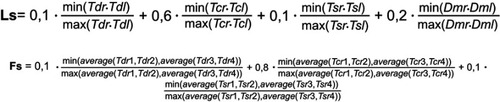
Table 4 Characteristics of the studies that assessed injuries prevention and rehabilitation