
Figures & data
Figure 1 Summary of all the measures that were performed in cyclists and crew groups during the study.
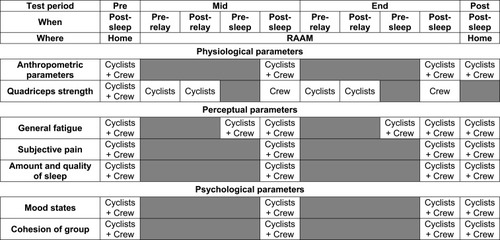
Figure 2 Evolution of positive elevation change (m) (represented by black bar histogram) and maximal temperature (°C) (represented by dashed curve) by section during the race. Left axis represents bar and right grey zones represent the two assessment times during the RAAM.
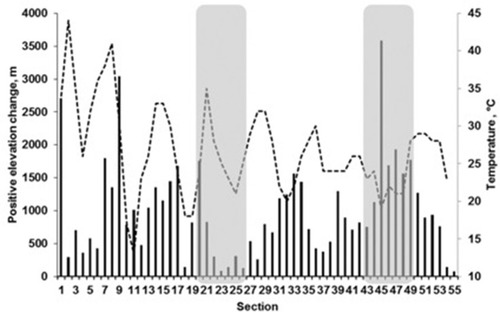
Table 1 Anthropometric Parameters
Figure 3 Maximal isometric voluntary quadriceps strength at pre, mid and end in cyclists and crew groups. *p < 0.05 for difference with Pre; †p < 0.05 for difference with cyclists pre-relay. Data are presented as mean ± SE.
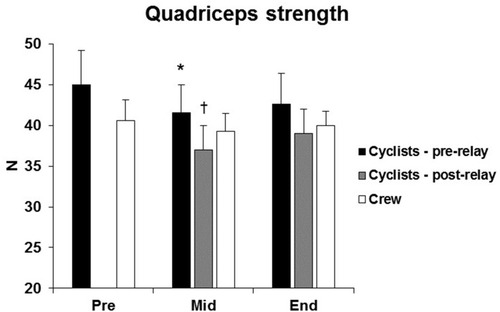
Figure 4 General fatigue at each assessment time in cyclists and crew groups. *p < 0.05 for difference with pre; #p < 0.05 for difference with post. Data are presented as mean ± SE.
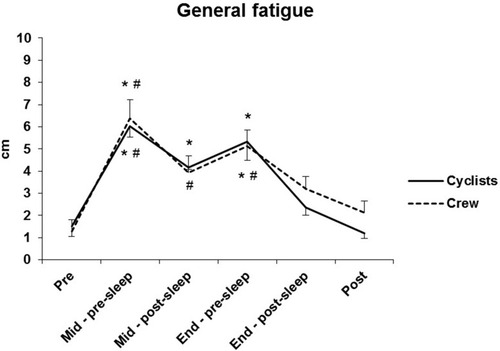
Table 2 Sleep Parameters
Table 3 Profile Of Mood State