Figures & data
Table 1 Characteristics of the study sample
Table 2 Comparisons of variables between Tai Chi and Control groups at baseline
Table 3 Comparisons of variables between Tai Chi and Control groups at endtest
Table 4 Comparisons of variables between endtest and follow-up of the Tai Chi group
Figure 1 Differences between endtest and follow-up periods for BMI, WHR, and blood pressure of the Tai Chi group.
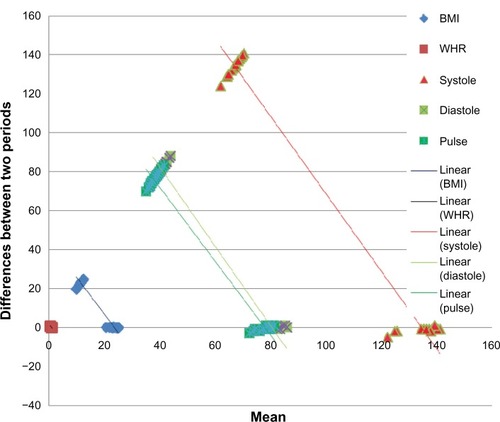
Figure 2 Mean BMI, WHR, and blood pressure of the Tai Chi and Control groups at three test times.
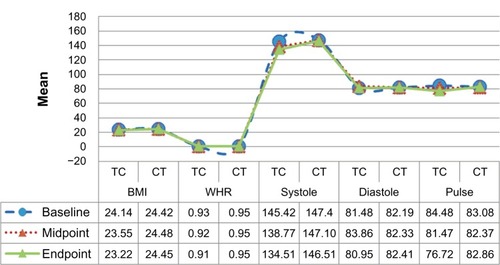
Figure 3 Differences between endtest and follow-up periods for senior fitness test (lower and upper strength) of the Tai Chi group.
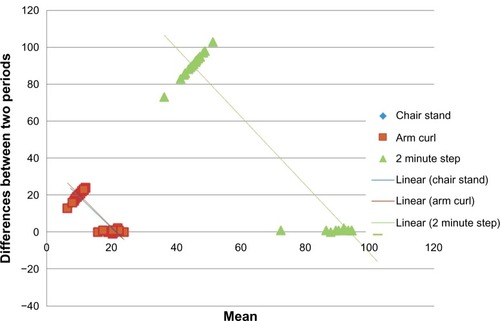
Figure 4 Mean SFT of the Tai Chi and Control groups at three test times.
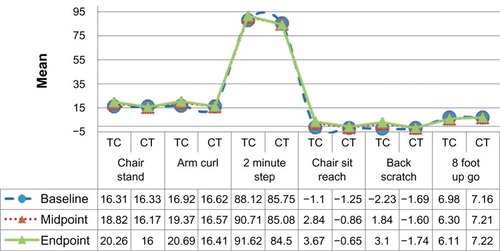
Figure 5 Differences between endtest and follow-up periods for SFT (lower-upper flexibility and dynamic balance) of the Tai Chi group.
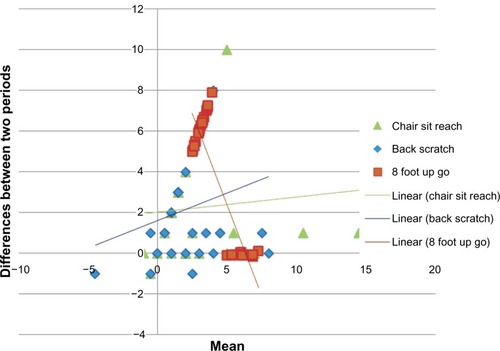
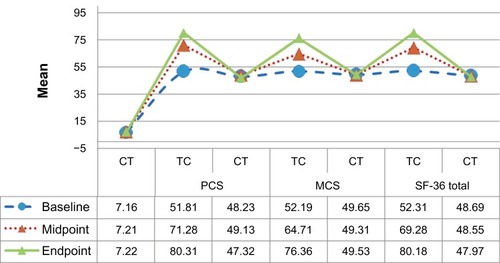
Figure 6 Differences between endtest and follow-up periods for SF-36 (PCS, MCS, and SF-36 total) for Tai Chi group.
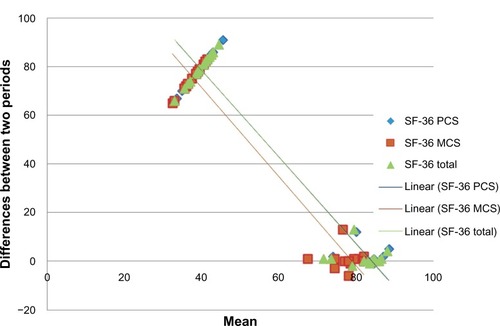
Figure 7 Mean SF-36 of the Tai Chi and Control groups at three test times.