
Figures & data
Figure 1 Illustration of matching of SRC to MSK and control athletes, followed by reasons for injury exclusions.
Notes: Of the 683 athletes who sustained an SRC, only 186 returned to play during the third through eighth week of the regular NFL season, and 91 could be matched with appropriate MSK and healthy controls.
Abbreviations: SRC, sports-related concussion; MSK, musculoskeletal; NFL, National Football League; RTP, return to play.
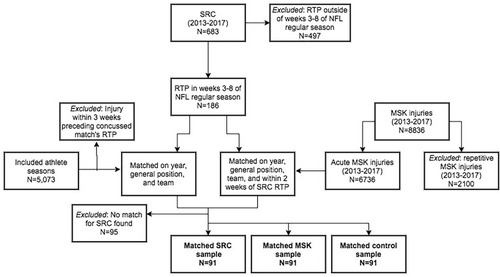
Table 1 Player Demographics by Injury Type
Table 2 Position Type and Injury Characteristics
Figure 2 Average cumulative MSK injury occurrence for 12 weeks following RTP from original injury of SRC, MSK, or healthy controls.
Notes: SRC athletes 2.35 times more likely to sustain an MSK compared to controls. MSK athletes were 1.87 times more likely.
Abbreviations: MSK, musculoskeletal; RTP, return to play; SRC, sports-related concussion; No, number.
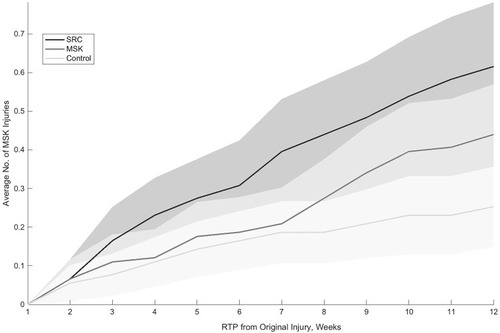
Table 3 Reinjury Occurrences