Figures & data
Figure 1 The Micro-Mobile compression® device. External (left) and long-axis cross sectional (right) views. Activation switch and pressure pad in raised position shown in right panel.
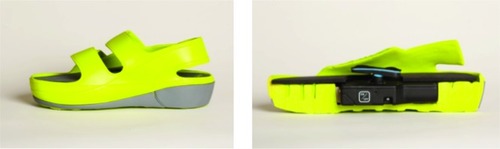
Table 1 Baseline subject characteristics
Table 2 Exercise capacity measures from cycle ergometer graded exercise test
Figure 2 Area under the 60-minute lactate curve after graded exercise test. P-value represents the difference in 60-minute area under the lactate curve with MMC versus control. Plotted values are means.
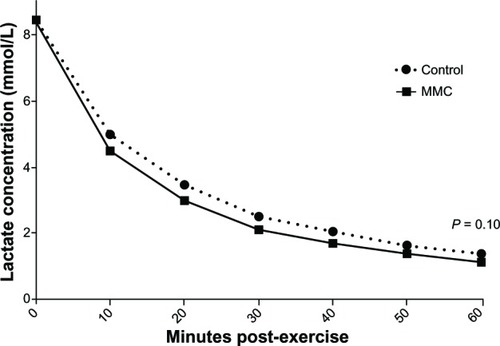
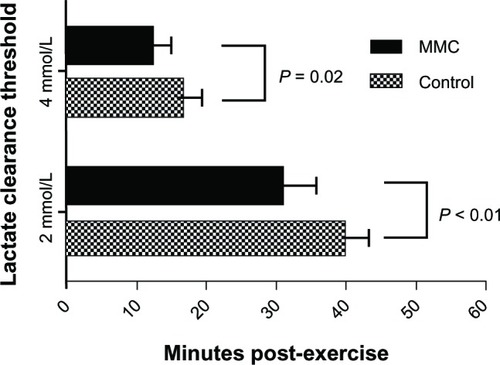
Figure 3 Lactate clearance time to 4 mM and 2 mM thresholds after graded exercise test. Values are means ± 95% confidence intervals.
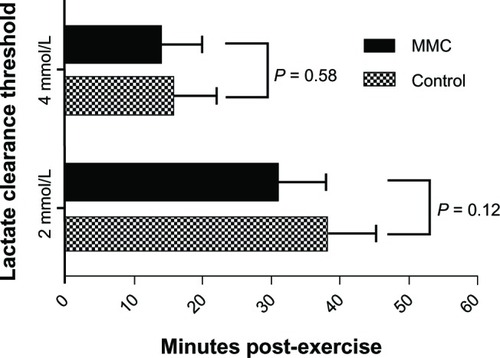
Figure 4 Area under the 60-minute lactate curve after fixed-load cycle ergometry at 85% peak power. P-value represents the difference in 60-minute area under the lactate curve with MMC versus control. Plotted values are means.
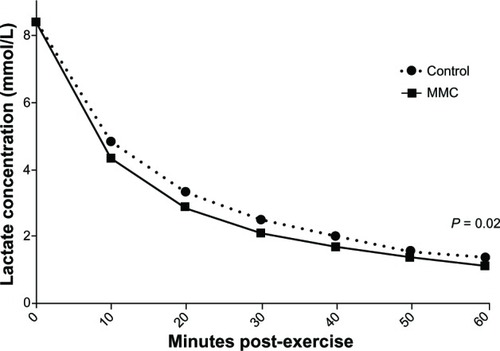
Figure 5 Lactate clearance time to 4 mM and 2 mM thresholds after fixed-load cycle ergometry at 85% peak power. Values are means ± 95% confidence intervals.