Figures & data
Table 1 Number of events held during the period 1971–2012
Table 2 Total number of female, male, and overall finishers up to and including 2012, by sex and distance
Table 3 Male and female finishers for each distance from 1971–2012
Table 4 The number of women, men, and the men-to-women ratio for each distance across calendar years
Figure 1 Running speed across calendar years from 50-mile to 3,100-mile events for the annual fastest runners.
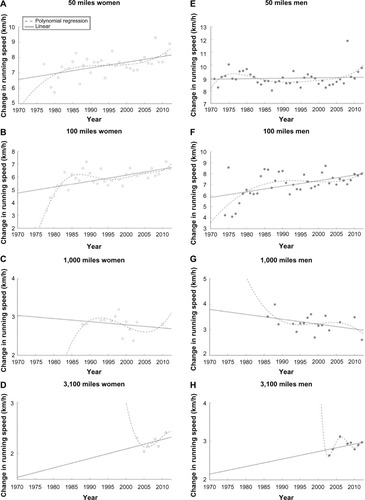
Table 5 Coefficients and standard errors from multivariate regression models for running speed of the annual fastest runners for each calendar year
Figure 2 Running speed across calendar years from 50-mile and 100-mile events for the annual ten fastest runners.
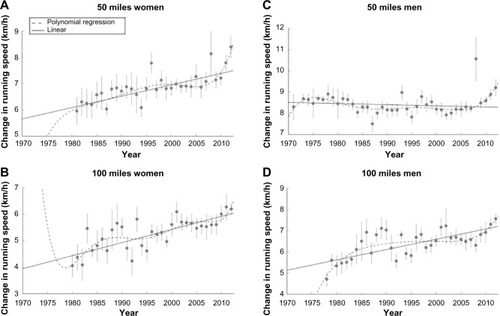
Table 6 Coefficients and standard errors from multivariate regression models for running speed of the annual ten fastest runners for each calendar year
Figure 3 Sex differences across calendar years from 50-mile (A), 100-mile (B), 1,000-mile (C), and 3,100-mile (D) events for the annual fastest runners.
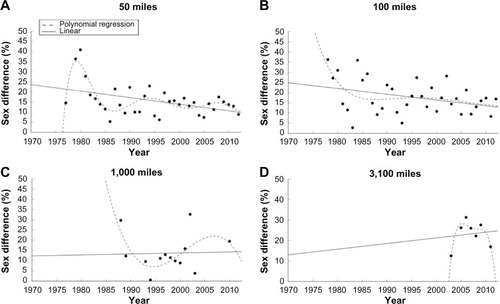
Figure 4 Sex differences across calendar years in 50-mile and 100-mile events for the annual ten fastest runners.
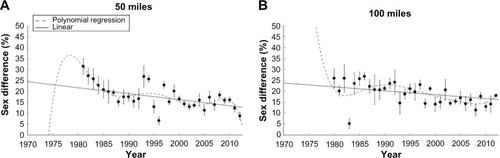
Table 7 Coefficients and standard errors from multivariate regression models for sex differences of the annual fastest runners for each calendar year
Table 8 Coefficients and standard errors from multivariate regression models for sex differences of the annual ten fastest runners for each calendar year
Figure 5 Running speeds from 50-mile to 3,100-mile events.
Abbreviation: NS, nonsignificant.
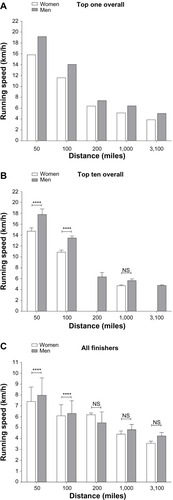
Figure 6 Sex difference in running speed from 50-mile to 3,100-mile events.
Abbreviation: NS, nonsignificant.
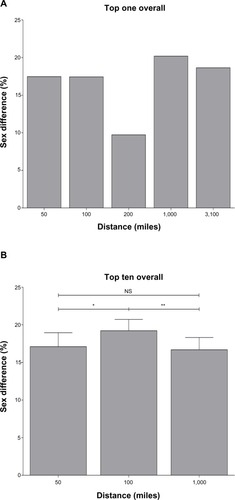
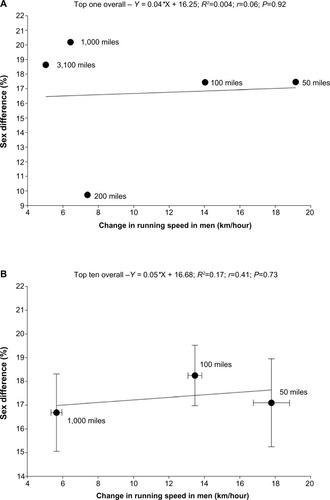
Figure 7 Sex differences in relation to running speed from 50-mile to 3,100-mile events.