
Figures & data
Figure 1 An overlap of two tunnel apertures.
Notes: (A) This arthroscopic view of the left knee shows the breakage of the bony bridge (large midair arrow) between two femoral tunnel apertures (group of small arrows). (B) A 3-D computed tomography computer-aided design model of the same knee is shown. An overlap of the two tunnel apertures (group of small arrows) has thus occurred.
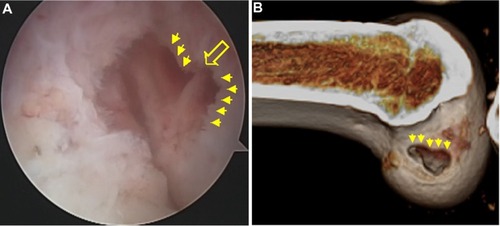
Figure 2 The definition of femoral tunnel position and measurement method.
Notes: (A) The position within the lateral femur was defined by the quadrant method.Citation22 Footprints of the anteromedial bundle (AMB) and posterolateral bundle (PLB) of the anterior cruciate ligament were superimposed onto the surface model of the femoral intercondylar notch based on the percentage from the posterior wall (deep–shallow) and from Blumensaat’s line (high–low), according to the footprint location reported in a previous cadaveric study.Citation23 (B) The distances between the AM and PL centers (d1), the AM center and the posterior bony edge of the intercondylar wall (d2), the PL center and the anterior border with cartilage (d3), and the PL center and the inferior border with cartilage (d4) were measured using the 3-D DICOM software package.
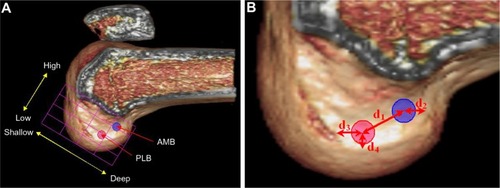
Figure 3 Relationships between anteromedial (AM) and posterolateral (PL) center distances and body height.
Notes: (A) Good correlation (R=0.66) was seen between the two parameters in males (P<0.01). (B) In addition, in females, good correlation (R=0.63) was seen between the two parameters (P<0.01).
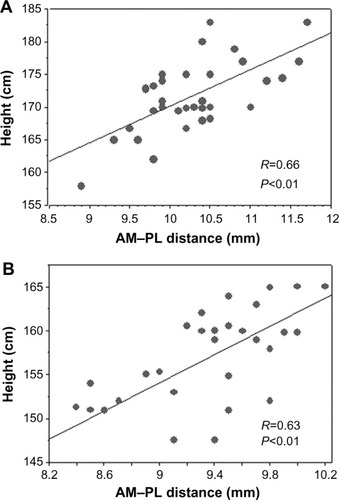
Table 1 Measurement results from the 3-D computed tomography knee models of intact femurs