
Figures & data
Table 1 Baseline Demographics and Characteristics for 433 Rheumatoid Arthritis Patients
Table 2 Descriptive Statistics for Lag 1 and Lag 2 Continues Variables
Figure 1 (A) Shows a pie chart representing the percentage of patients who received Anti-TNF bDMARDs, Non-Anti-TNF DMARDs and those who received only csDMARDs. (B) Provides the percentages of each agent used among both anti-TNF bDMARDs and non-anti-TNF DMARDs.
Abbreviations: Anti-TNF bDMARDs, anti-tumor necrosis factor biologic disease-modifying anti-rheumatic drugs; csDMARDs, conventional synthetic disease-modifying anti-rheumatic drugs; Non-Anti-TNF DMARDs, non-anti-tumor necrosis factor disease-modifying anti-rheumatic drugs.
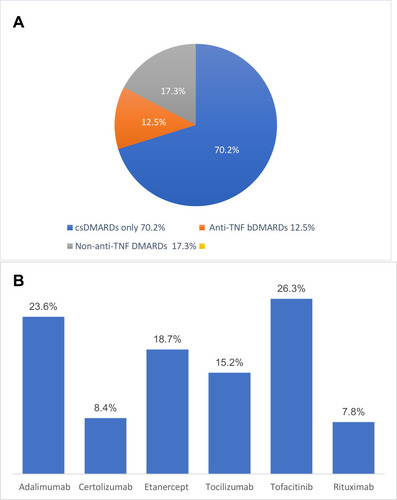
Table 3 Multiple Regression Model (DAS-28 Dependent)