
Figures & data
Table 1 Baseline Demographic Information of Participants and Bivariate Analysis of Difference Between Methotrexate Tolerant and Methotrexate Intolerant Groups
Table 2 Baseline Methotrexate Related Information of Participants and Bivariate Analysis of Difference Between Methotrexate Tolerant and Methotrexate Intolerant Groups
Table 3 Rheumatoid Arthritis Related Information of Participants and Bivariate Analysis of Difference Between Methotrexate Tolerant and Methotrexate Intolerant Groups
Table 4 Binary Logistic Regression Analysis to Determine Factors Associated with Methotrexate Intolerance Among the Study Population Adjusted by Age, Gender, and Disease Duration
Figure 1 Radar chart of Methotrexate Intolerance Severity Score (MISS) and related components.
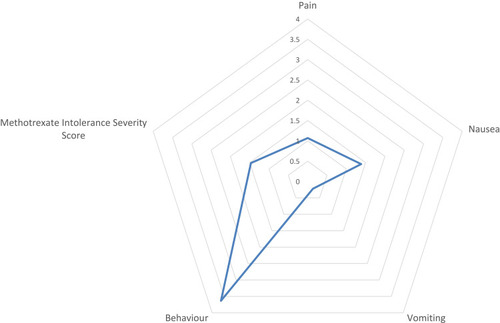
Table 5 Model of Linear Regression to Determine Factors Affecting Methotrexate Intolerance Severity Score (MISS), Adjusted to Age, Gender, and Rheumatoid Arthritis Duration