Figures & data
Figure 1 (A and B) demonstrate nailfold video-capillaroscopy findings in a patient with very early SSc who presented with RP and anticentromere antibodies. Arrows in (A) identify giant capillaries. (B) demonstrates capillary drop-out; the arrow in this panel identifies a microhemorrhage.
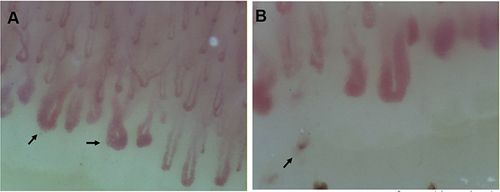
Figure 2 The ACR/EULAR 2013 Classification Criteria for SSc, highlighting the criteria for very early SSc. A total score of 9 is sufficient to classify patients with definite SSc.
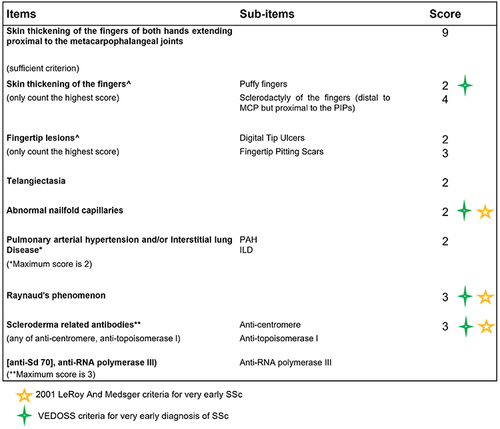
Table 2 Initial Evaluation of a Patient with Very Early or Early SSc
Figure 3 Flow chart for the evaluation of patients with early SSc by organ system with description of risk factors and diagnostic testing.
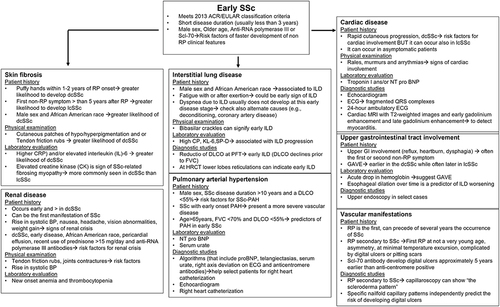
Table 3 Clinical Correlates of Autoantibody Profiles in SSc
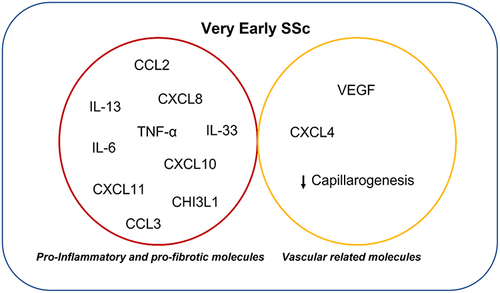
Figure 4 Proteins related to very early SSc disease stages.