Figures & data
Figure 1 Radiographic findings in twin A and twin B. Characteristic erosive and osteoproliferative alterations including typical pencil in cup lesions are evident; tarsal and metatarsal joints of both feet were involved in twin A (A and B). In twin B (D and E) X-ray show less severe lesions, of note the erosive findings in the first PIP of the left foot (E). Sacroiliitis was detectable in both patients (C and F).
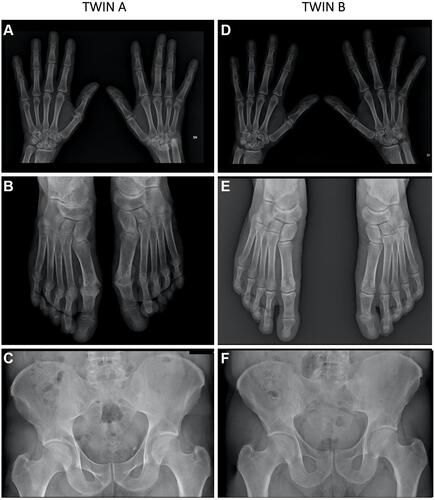
Table 1 List of Selected Coding Differentially Expressed Genes Between A and B Twins. Coding DEGs with a Relevant Physiopathologic Role Were Extrapolated from the Comparative Gene Expression Analysis (Fold Change Cutoff ± 2.0; Total DEGs= 163, of Which Coding DEGs= 36), by Combining the IPA Bioinformatic Analysis with the Literature (Input: Function/Disease Search)
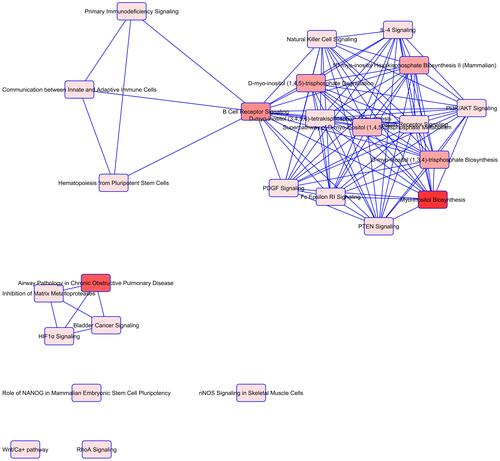
Figure 2 Overlapping Canonical Pathways map generated by Ingenuity Pathway Analysis. A pathway network was generated representing from the top of overrepresented pathways determined by IPA, to reveal shared biology among the identified candidate genes. Notes: edge-connected canonical pathways share one or more genes in common. Nodes represent pathways and bright red represents more significant canonical pathways in the gene set. The canonical pathways map was generated by QIAGEN’s Ingenuity Pathway Analysis (QIAGEN Inc., https://www.qiagenbioinformatics.com/products/ingenuity-pathway-analysis).