
Figures & data
Table 1 Demographic Data of JSLE Patients Included in This Study (n=100)
Table 2 Distribution of Different Clinical, Laboratory Data and SLEDAI Score Among JSLE Patients (n=100)
Figure 1 Distribution of renal biopsy classes among JSLE patients with lupus nephritis (n=51).
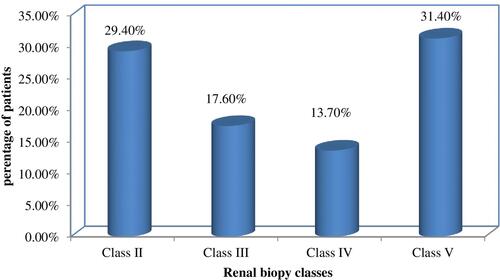
Table 3 Distribution of Anti ds DNA and Different Anti-ENA Antibodies Profile in Relation to Different Clinical Manifestations and SLEDAI Score in JSLE Patients (n=100)
Figure 2 Distribution of anti-ENA and other autoantibodies found among JSLE patients. (n=100).
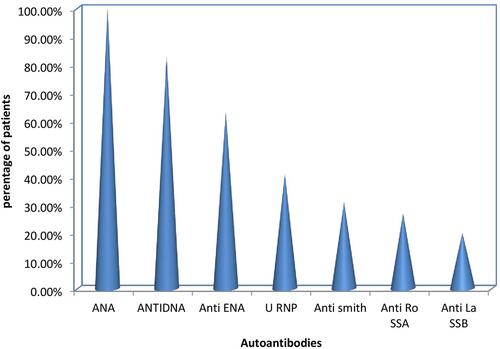
Table 4 Multivariate Regression Analysis of All Variable as a Predictor of Autoantibodies Profile in JSLE Patients (n=100)