Figures & data
Table 1 Data from Septic Arthritis Cases Between 2017 and 2020 (n=72,005)
Table 2 Prevalence and Incidence of Septic Arthritis per 100,000 Person-Years with 95% CI in Thailand from 2017 to 2020
Figure 1 Number of patients with septic arthritis per 100,000 by hospital-based visit. (QGIS software version 3.8.2: an open source and free software of geographic data system information was used for generating the maps; https://www.qgis.org/en/site/). (A) Number of septic arthritis in 2017 (prevalence cases). (B) Number of new cases of septic arthritis in 2018 (incidence cases). (C) Number of new cases of septic arthritis in 2019 (incidence cases). (D) Number of new cases of septic arthritis in 2020 (incidence cases).
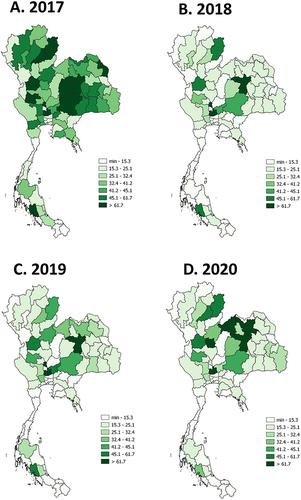
Table 3 Common Causative Organisms and Affected Joints in the 2017
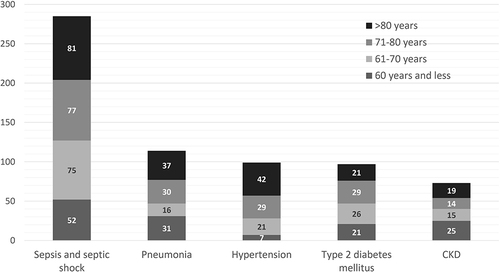
Figure 2 Age group in the top 5 common causes of death in patients with septic arthritis in 2017–2020.