
Figures & data
Table 1 Baseline Characteristics
Figure 1 Changes over time in MMP-3 (A) and KL-6 (B) levels. *P<0.05, ***P<0.001 by the Wilcoxon signed-rank test for comparison of paired samples.
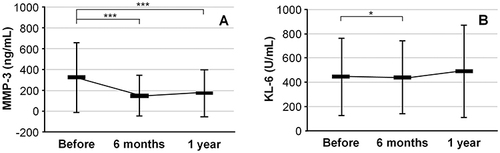
Figure 2 Results of linear regression analysis of the relationship between percent changes in MMP-3 and KL-6 at 6 months (A) and 1 year (B) after the start of treatment. The coefficients of determination (R2) are shown.
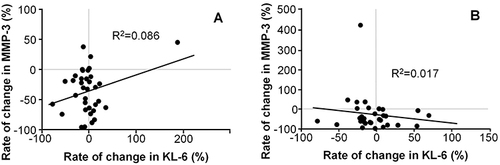
Figure 3 Relationship between percent change in KL-6 and RA activity group at 6 months (A) and 1 year (B) after the start of treatment. The PD group with RA progression also showed an increase in KL-6 at 6 months after RA treatment. *P<0.05 by the Tukey-Kramer HSD test.
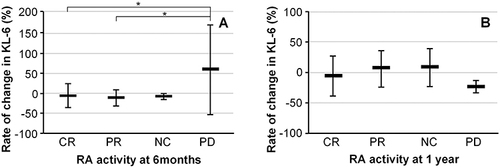
Figure 4 Relationship between MMP-3 and ILD activity evaluated by chest CT at 1 year after RA treatment. The group with ILD progression on chest CT also showed increased MMP-3. *P<0.05, **P<0.01 by the Tukey-Kramer HSD test.
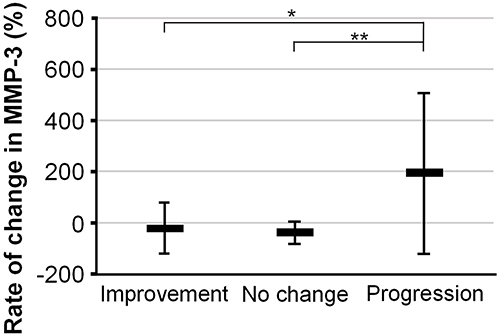
Table 2 % Change in MMP-3 and KL-6 According to Type of ILD
Table 3 Mortality (%) in RA Patients with ILD