
Figures & data
Table 1 Definitions of different levels of VA according to visual standards by the International Council of OphthalmologyCitation18 using ETDRS and Snellen equivalent charts
Figure 1 Proportion of subjects, F, and NF, with non-normal visual test results.
Notes: VA was more often slightly reduced among the NF than F. Severe or profound VA loss was seen in a few subjects among the NF only. Reduced CS in the better eye was slightly more common among F than NF; the opposite was true when testing CS binocularly. Doubtful or negative stereopsis was just slightly more common among the F than NF.
Abbreviations: CS, contrast sensitivity; F, fallers; ICD, International Classification of Diseases; NF, non-fallers; VA, visual acuity.
Abbreviations: CS, contrast sensitivity; F, fallers; ICD, International Classification of Diseases; NF, non-fallers; VA, visual acuity.
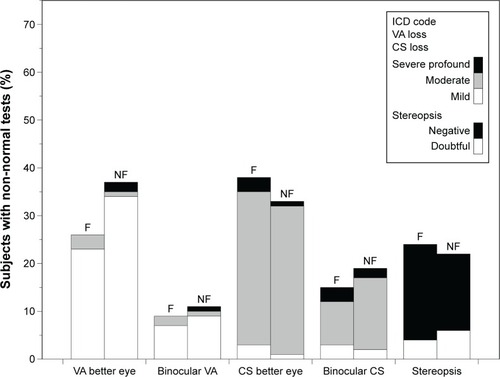
Table 2 Visual function tests as presumed risk for falls vs no falls