Figures & data
Figure 1 Ocular surface staining at baseline and month 6.
Notes: Both eyes of patients were treated with cyclosporine for 6 months. The worse eye was defined as the eye with the worse central corneal staining at baseline. Mean scores of fluorescein corneal and total ocular surface staining and lissamine green conjunctival staining in the worse treated eyes (A) and fellow treated eyes (B) are shown. P-values are from paired t-tests. Error bars indicate standard error of the mean.
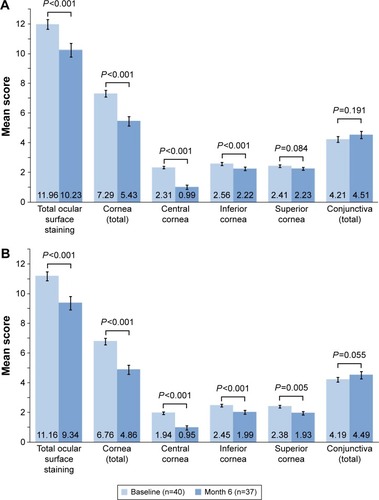
Figure 2 Mean scores related to visual function on the OSDI.
Notes: The occurrence of symptoms of poor visual function within the past week and limitations in the performance of tasks due to problems with the patient’s eyes within the past week were evaluated on the OSDI at baseline and month 6. Scores could range from 0 to 4 with 0= none of the time, 1= some of the time, 2= half of the time, 3= most of the time, and 4= all of the time. P-values are from paired t-tests. Error bars indicate the standard error of the mean.
Abbreviations: OSDI, ocular surface disease index; TV, television.
Abbreviations: OSDI, ocular surface disease index; TV, television.
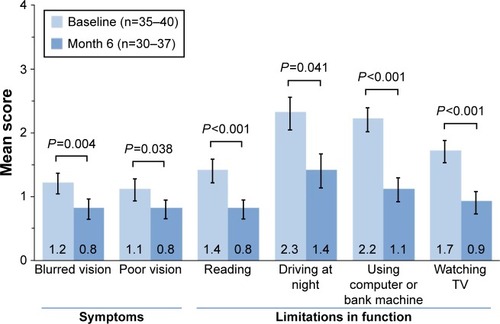
Figure 3 Tear production.
Notes: (A) Mean average eye Schirmer test scores at baseline and month 6. Error bars indicate standard error of the mean. (B) Percentage of patients who achieved at least a 5 mm or 10 mm increase from baseline in average eye Schirmer test scores at month 6. P-value is from a paired t-test.
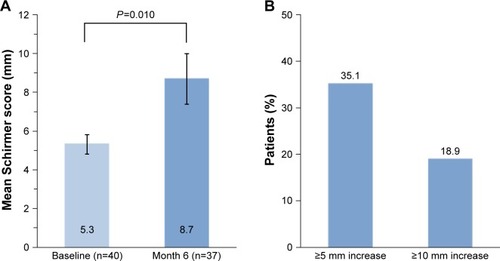
Figure 4 Mean (A) TBUT and (B) interblink interval in worse treated eyes at baseline and month 6.
Notes: Interblink interval is defined as the time between blinks. P-values are from a paired t-test (A) or the Wilcoxon signed-rank test (B). Error bars indicate standard error of the mean.
Abbreviation: TBUT, tear film breakup time.
Abbreviation: TBUT, tear film breakup time.
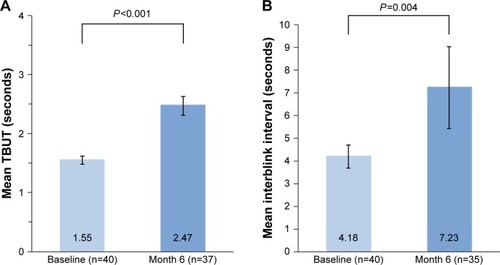
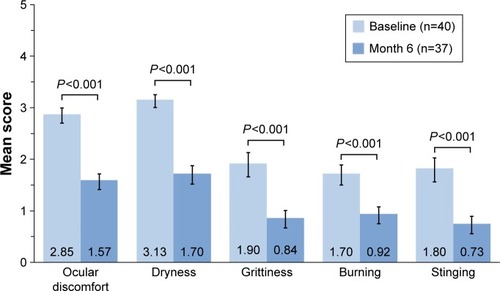
Figure 5 Mean scores on the Ora Calibra™ Ocular Discomfort and 4-Symptom Questionnaire at baseline and month 6.
Notes:
P-values are from paired t-tests. Error bars indicate standard error of the mean.