
Figures & data
Table 1 Baseline demographics of the study participants
Table 2 Change in macular pigment optical density and total macular pigment complement using the DWAF
Figure 1 Averaged MPOD profiles in patients at baseline per retinal disease.
Abbreviations: AMD, age-related macular degeneration; ARM, age-related maculopathy; CSR, central serous retinopathy; DR, diabetic retinopathy; MPOD, macular pigment optical density.
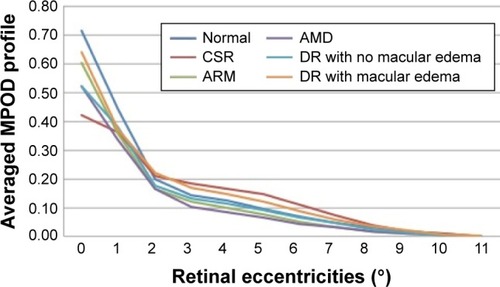
Figure 2 Averaged MPOD profiles in patients at 6 months post-supplementation per retinal disease.
Abbreviations: AMD, age-related macular degeneration; ARM, age-related maculopathy; CSR, central serous retinopathy; DR, diabetic retinopathy; MPOD, macular pigment optical density.
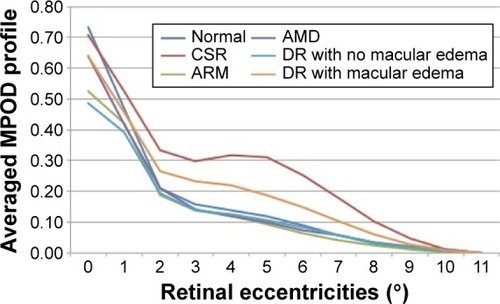
Table 3 Change in contrast sensitivity measurements in various conditions
Table 4 Change in the quality of life as measured by NEI-VFQ-25Citation20 and EQ-5DCitation39