Figures & data
Table 1 Demographics and baseline characteristics of study patients and eyes
Figure 1 Evolution of central subfield thickness after intravitreal insertion of FAc implant. P-values are for comparison with baseline value.
Abbreviations: FAc, fluocinolone acetonide; VEGF, vascular endothelial growth factor.
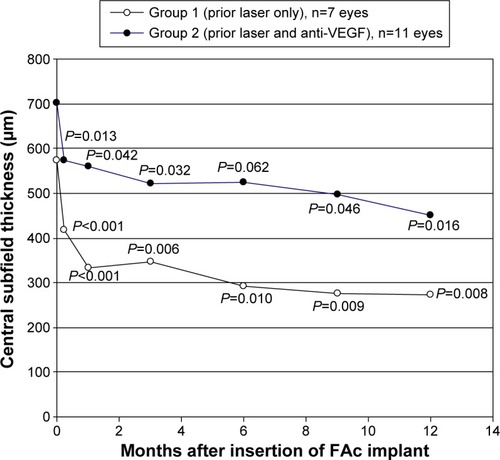
Table 2 Efficacy results for CST and BCVA at defined times after insertion of the fluocinolone acetate implant (intention-to-treat population)
Figure 2 Mean gain of visual acuity after 1 year of treatment after intravitreal insertion of FAc implant (intention-to-treat population with LOCF).
Abbreviations: FAc, fluocinolone acetonide; BCVA, best-corrected visual acuity; LOCF, last observation carried forward.
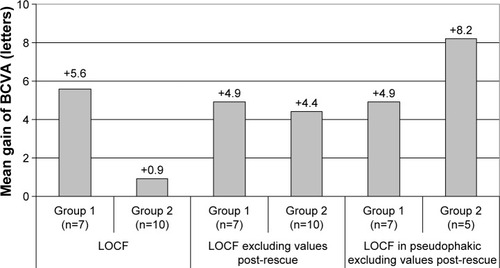
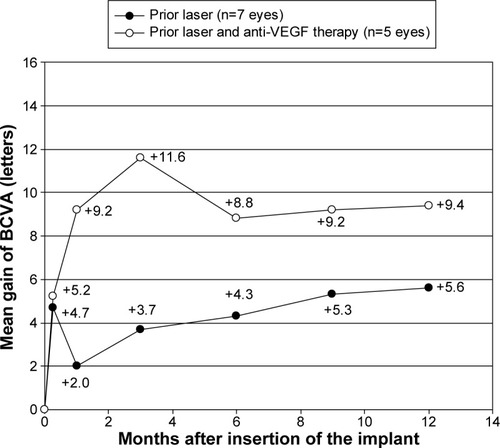
Figure 3 Mean gain of visual acuity during study in pseudophakic patients (intention-to-treat population).
Abbreviations: BCVA, best-corrected visual acuity; VEGF, vascular endothelial growth factor.