Figures & data
Figure 1 The design of the thick endocapsular open ring.
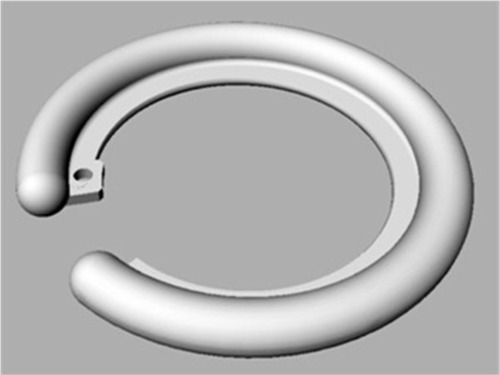
Table 1 Patient demographics
Figure 2 The slit-lamp retroillumination photo of PCO in eye with tilted IOL and one haptic located in the ring gap.
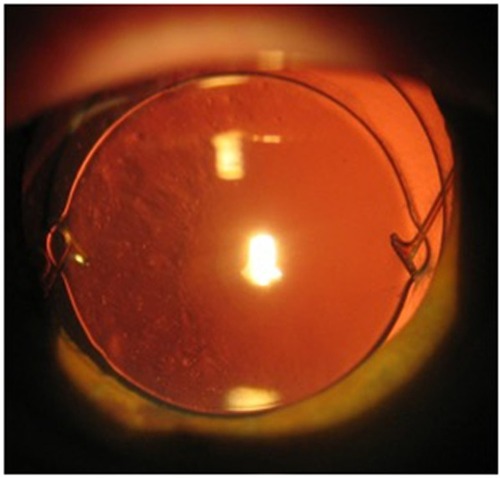
Figure 3 The slit-lamp retroillumination photos of peripheral PCO development at the ring gap in the same eye at 3 (A), 12 (B), and 36 (C) months postoperatively.
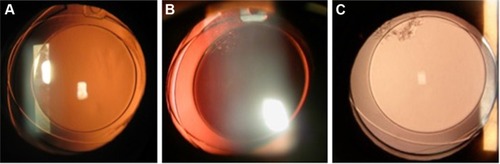
Figure 4 The slit-lamp retroillumination photo of the right eye (A) with the ring and left eye (B) without the ring 36 months postoperatively in the same patient.
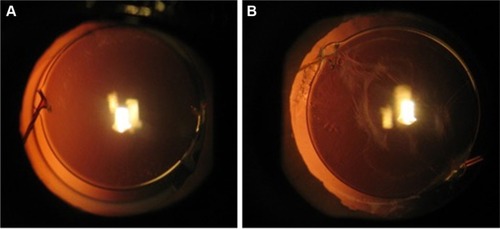
Figure 5 The anterior segment optical coherence tomography (A) and slit-lamp (B) photos of anterior capsule wrinkling of the same patient (arrows).
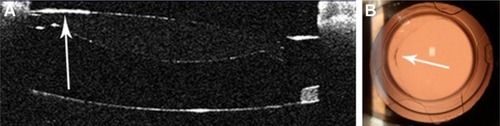
Figure 6 The slit-lamp retroillumination photos before (A) and 4 months after the IOL exchange (B).
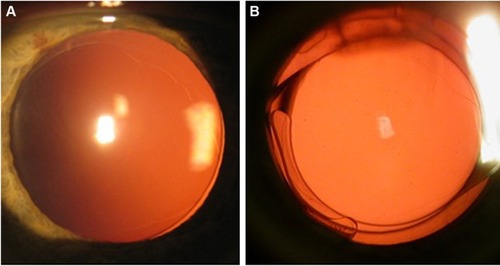
Figure 7 The anterior segment optical coherence tomography photo (A) and slit-lamp photo (B) of clear anterior capsule showing the distance between IOL optic and posterior capsule.
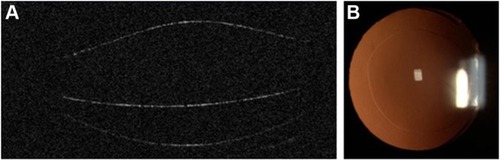
Figure 8 Anterior segment optical coherence tomography photo showing disrupted barrier effect of the ring (arrow) and opacification of the posterior capsule.
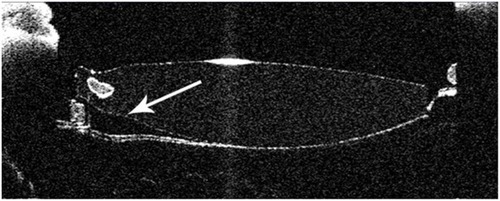
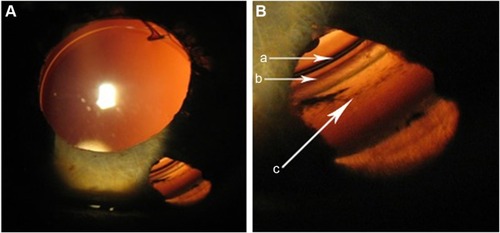
Figure 9 The slit-lamp photo of the peripheral capsule with the ring and Zinn zonules through iridotomy in a patient with previous phakic IOL implantation surgery (a – IOL rim, b – the ring groove, c – anterior capsule zonule attachment). Image B is a higher magnification of the lower right-hand part of image A.