Figures & data
Figure 1 Illustrative model depicting the components of and factors influencing psychological well-being.
Notes: In this model, psychological well-being is divided into three components, as indicated by dashed lines: 1, interpersonal interactions; 2, mood (affect); and 3, career goals. The primary physiological stressor in this model, profound vision loss, may influence psychological well-being (unidirectional red arrow). Bidirectional black arrows indicate potential effects of each component on one another. For example, mood or affect may impact interpersonal life, and such an effect may influence mood or affect.
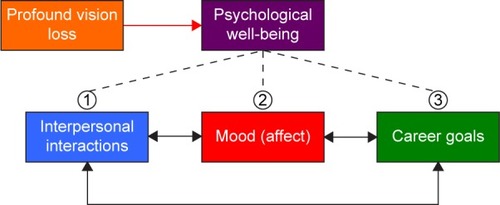
Table 1 Participant demographic and clinical characteristics (N=103)
Figure 2 Interpersonal and career impact ratings.
Notes: Subjective IR distributions for interpersonal interactions (A) and career goals (B) among 103 participants. Each circle in these distributions corresponds to the impact rating of one participant. Among subjects with presumed depression, median interpersonal IR (C) and career IR (D) were statistically significantly lower (*P=0.001 and *P<0.001, respectively) than among those who did not meet criteria for presumed depression. The boxes define the IQR between the Q1 and Q3. Median values are represented by a horizontal black line inside each box. Each vertical line extends from the minimum to the maximum value. Outliers were defined as values that exceed Q3 by >1.5>IQR or that lie >1.5>IQR beneath Q1. No outliers were observed in these data sets. The P-values are determined by the Mann–Whitney U test.
Abbreviations: IQR, interquartile range; IR, impact rating; Q1, first quartile; Q3, third quartile.
Abbreviations: IQR, interquartile range; IR, impact rating; Q1, first quartile; Q3, third quartile.
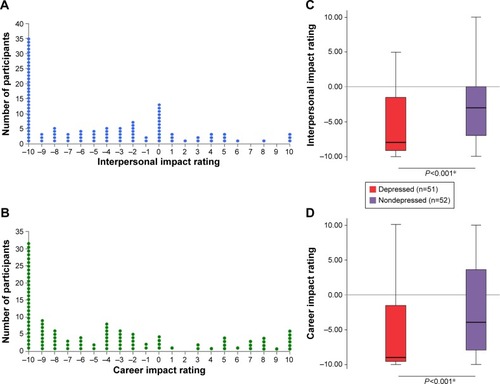
Figure 3 Percentages of subjects with presumed depression (A), negative interpersonal IR (B), and negative career IR (C) distributed by age-group at the time of diagnosis of profound vision loss secondary to LHON (N=103).
Notes: In all three of these distributions, percentages tend to increase as chronological age increases. Statistically significant differences among pairwise comparisons are indicated by horizontal black lines. Error bars represent standard deviation of proportion. †P<0.01 (chi-square test), ‡P<0.001 (chi-square test), *P<0.05 (Fisher’s exact test), **P<0.01 (Fisher’s exact test).
Abbreviations: IR, impact rating; LHON, Leber’s hereditary optic neuropathy.
Abbreviations: IR, impact rating; LHON, Leber’s hereditary optic neuropathy.
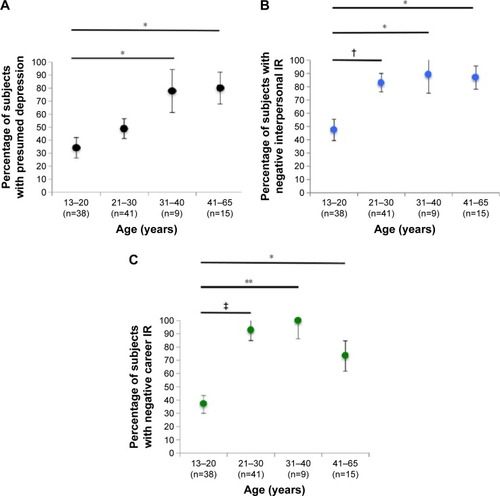
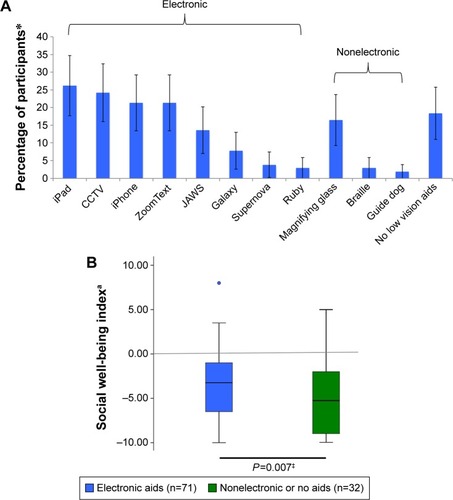
Figure 4 Low vision aids used among participants and impact of electronic low vision aids on social well-being index (N=103).
Notes: (A) Black brackets group electronic aids (left) and nonelectronic aids (right). For purposes of clarity, only responses listed by >1 participant are presented. No responses of “other (specify)” were similar to one another. Approximately 6.8% of individuals (7/103) indicated other (specify). These responses included: audiobooks, ID Mate Barcode Scanner, talking kitchen scale, Windows Magnify, binocular glasses, clip-on loupes, and white cane. Error bars are 95% confidence intervals. (B) Box-and-whisker plot diagrams depicting social well-being index. The median of this index (horizontal black line inside each box) was statistically significantly higher (P=0.007) for subjects who use electronic low vision aids (blue box, n=71) than for those who use exclusively nonelectronic aids or no vision aids (green box, n=32). The data set for electronics users contains a single outlier (blue circle). iPad (tablet; Apple); CCTV (for text/image magnification); iPhone (smartphone; Apple); ZoomText (screen magnification software/screen reader; Ai Squared); JAWS (screen magnification software/screen reader; Freedom Scientific,); Galaxy (smartphone; Samsung); Supernova (screen magnification software/screen reader; Dolphin); and Ruby (Freedom Scientific, handheld video magnifier). aSocial well-being index is calculated as the average of an individual’s interpersonal impact rating and career impact rating. ‡Determined by Mann–Whitney U test. *Total percentage is greater than 100%, as some individuals provided more than one response.
Abbreviations: CCTV, closed-circuit television; JAWS, Job Access With Speech.
Abbreviations: CCTV, closed-circuit television; JAWS, Job Access With Speech.