Figures & data
Figure 1 An example of the location pattern of 10×10 grids in the 6×6 mm analysis area and 3.4 mm diameter circle centered on the disc.
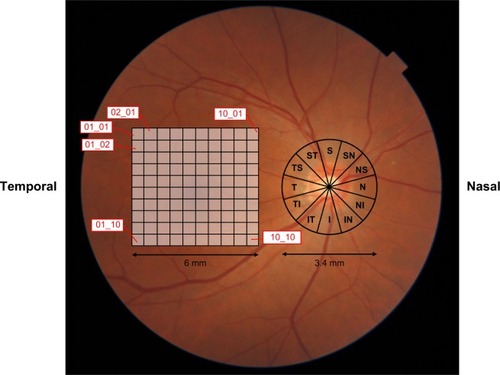
Figure 2 Distribution of four measurements between glaucoma-positive and glaucoma-negative (normal) subjects.
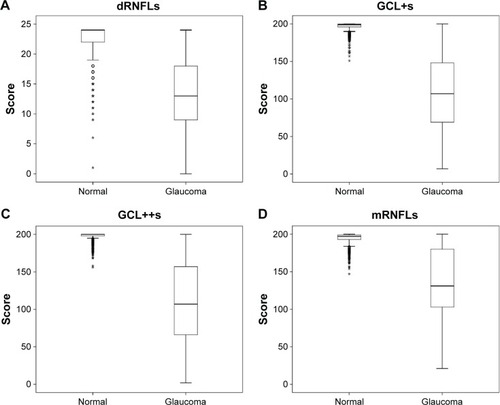
Figure 3 Receiver operating characteristic (ROC) curve using four measurements.
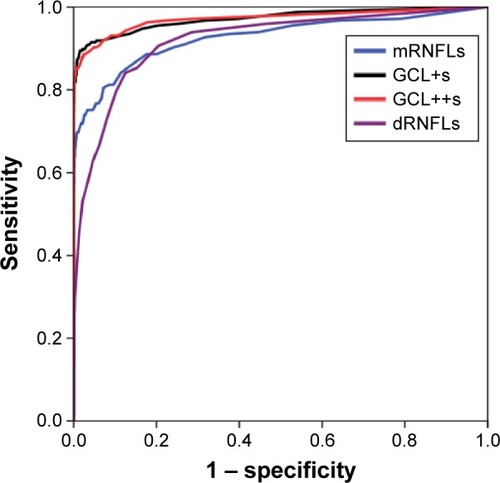
Table 1 The area under the receiver operating characteristic curve (AUC-ROC)
Table 2 Performance of automatic spectral domain-optical coherence tomography (ASD-OCT) screening in a case–control setting
Table 3 Results of automatic spectral domain-optical coherence tomography (ASD-OCT) screening in a population setting of the general workers
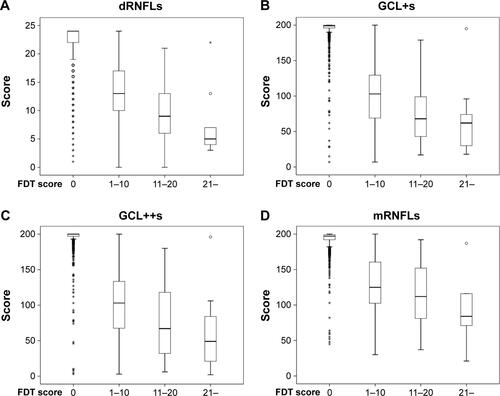
Figure S1 The distribution of dRNFLs (A), GCL+s (B), GCL++s (C), and mRNFLs (D), stratified by FDT results.
Notes: According to FDT results, each grade in a field was scored as follows: 0= normal, 1= mild relative loss, 2= moderate relative loss, and 3= severe loss. Total score was summed among 17 areas and was classified into four grades as an FDT score: 0, 1–10, 11–20, and 21–. The distribution of the sum of each grid (dRNFLs (A), GCL+s (B), GCL++s (C) and, mRNFLs (D)) is shown.
Abbreviations: dRNFLs, sum of the score in disc retinal nerve fiber layer; FDT, frequency-doubling technology; GCL+s, sum of the score in ganglion cell-inner plexiform layer; GCL++s, sum of the score in ganglion cell complex; mRNFLs, sum of the score in macular retinal nerve fiber layer.