
Figures & data
Table 1 Demographics of the study population
Figure 1 Imaging of two chronic central serous chorioretinopathy (cCSC) patients.
Notes: Images demonstrate characteristic findings in long-standing cCSC on optical coherence tomography (OCT) and fluorescein angiography (FA). (A–C) Fluctuating subretinal fluid (SRF) accumulation on OCT in the right eye of a patient, and typical subfoveal retinal pigment epithelium detachments. The time between scans A and B was 1 month, in which a clear decrease in SRF occurred, and between scans B and C another 2 weeks elapsed, showing a spontaneous increase in SRF. No therapeutic interventions had been performed between these visits. (D–G) FA and OCT of the right and left eyes of a cCSC patient suffering from bilateral extensive cCSC. On FA, a large area of hyperfluorescence can be seen, indicating advanced disease (D, E). OCT shows not only serous SRF in the right eye but also bilateral central posterior cystoid degeneration, indicative of long-standing disease (F, G). This central posterior cystoid degeneration resolved spontaneously after a period of approximately 6 months (H, I).
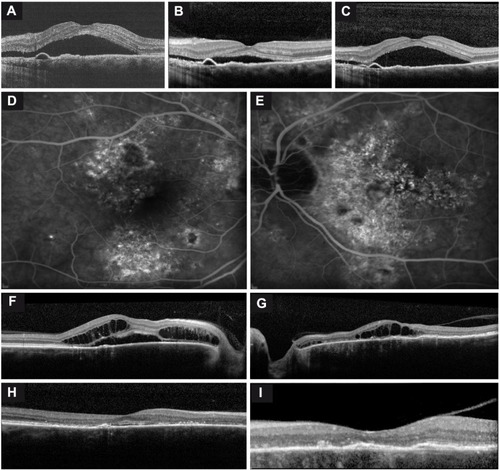
Table 2 Overview of findings on optical coherence tomography and fluorescein angiography
Figure 2 Abnormalities on fluorescein angiography (FA), indocyanine green angiography (ICGA), and fundus autofluorescence in chronic central serous chorioretinopathy.
Notes: (A, B) The appearance of “new” hot spots, highlighted by two arrows, on FA during 4 years of follow-up. (C, D) The development of a gravitational tract was observed originating from the initial leakage area after 6 years of follow-up. (E, F) Examples of differences seen in the extent of the hyperfluorescence areas between FA (E) and ICGA (F). The area depicted by the arrow shows clear hyperfluorescence on ICGA, but is not evident on the mid-phase FA. (G, H) ICGA (H) shows small punctiform hyperfluorescent areas in addition to diffuse hyperfluorescence. The corresponding FA (G) of the same patient shows an area of hyperfluorescence that is significantly smaller than the area seen on ICGA.
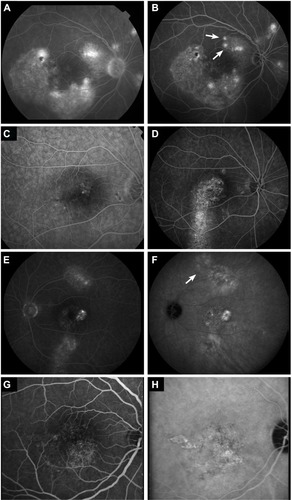
Table 3 VFQ-39 questionnaire scores of the study population and controls, and Pearson’s correlation with last visual acuity