
Figures & data
Figure 1 McMonnies (1986) questionnaire.
Notes: Adapted from McMonnies CW. Key questions in a dry eye history. J Am Optom Assoc. 1986;57:512–517.Citation40 Copyright © 1986 the American Optometric Association.
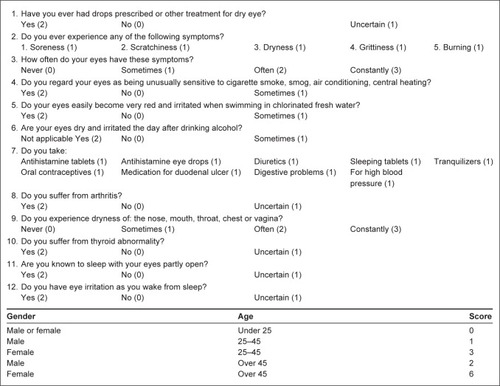
Table 1 Mean age and SD for patients and control groups
Table 2 Comparison between mean CCT (μm) and SD for both groups
Table 3 Description of CCT (μm; control and patient groups)