Figures & data
Table 1 Baseline characteristics
Figure 1 Mean time to retreatment for each treatment cycle. Error bars represent 95% confidence intervals.
Abbreviations: BRVO, branch retinal vein occlusion; CRVO, central retinal vein occlusion.
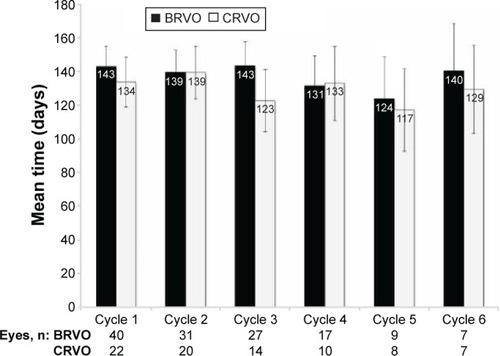
Figure 2 Mean peak change from baseline in best-corrected visual acuity (BCVA) in each treatment cycle.
Notes: (A) BCVA; (B) central retinal vein occlusion. Error bars represent 95% confidence intervals.
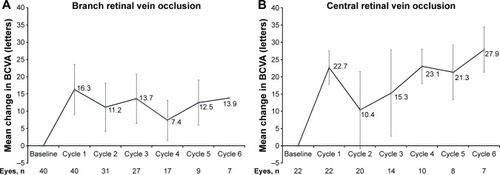
Figure 3 Percentage of patients achieving three or more lines of improvement in best-corrected visual acuity in each treatment cycle.
Notes: (A) Branch retinal vein occlusion; (B) central retinal vein occlusion.
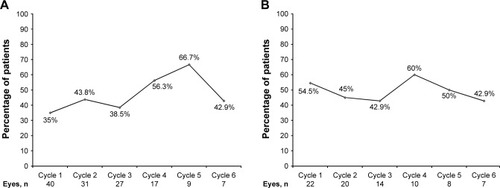
Figure 4 Mean peak change from baseline in central foveal thickness (CFT).
Notes: (A) Branch retinal vein occlusion; (B) central retinal vein occlusion. Error bars represent 95% confidence intervals.
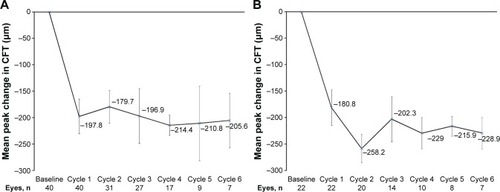
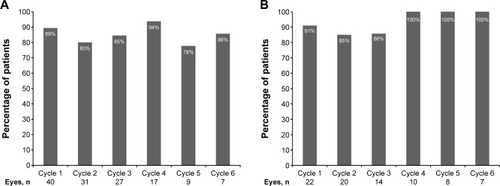
Figure 5 Percentage of patients with central foveal thickness ≤300 μm at any time in each treatment cycle.
Notes: (A) Branch retinal vein occlusion; (B) central retinal vein occlusion.