
Figures & data
Figure 1 Results of a phase II randomized trial retreatment criteria.
Abbreviations: CNV, choroidal neovascularization; FA, fluorescein angiography; OCT, optical coherence tomography; PDT, photodynamic therapy.
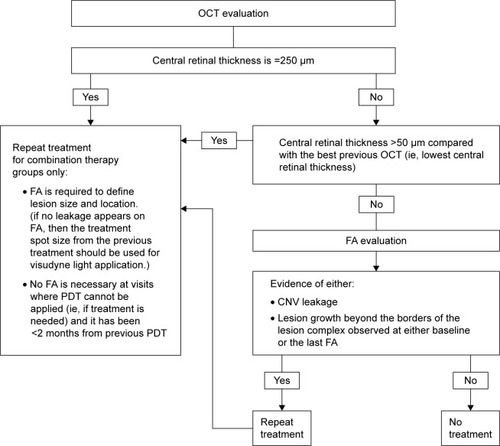
Figure 2 Subject disposition through 24 months.
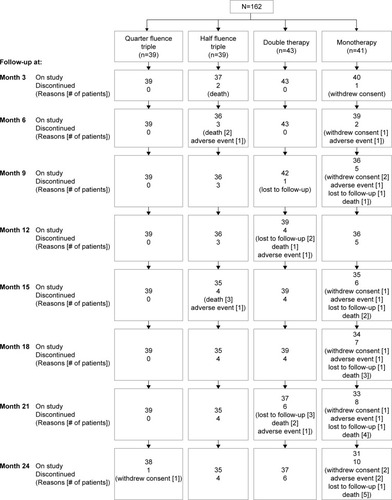
Figure 3 Cumulative mean number of visits at which retreatment was applied (excluding day 0).
Abbreviation: ITT, intent to treat.
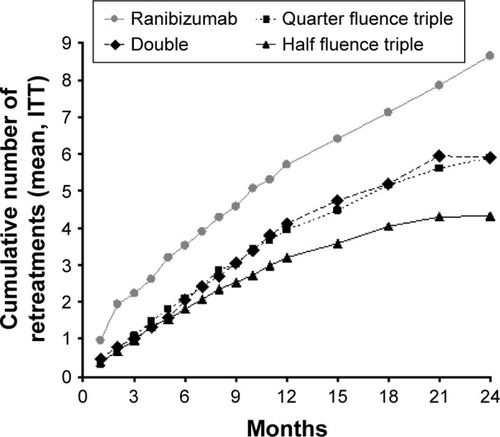
Table 1 Summary of treatmentTable Footnotea
Figure 4 Mean visual acuity letter score change from baseline through 12 months (1 line equals 5 letters; ITT LOCF).
Abbreviations: ITT, intent to treat; LOCF, last observation carried forward.
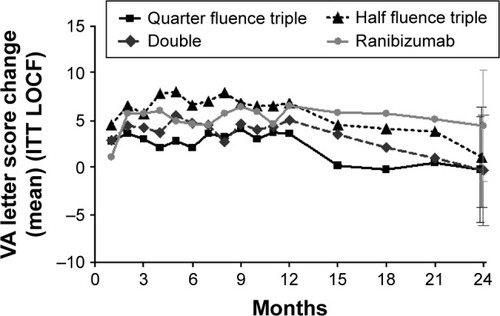
Table 2 Summary of AE