
Figures & data
Table 1 Non-paraneoplastic autoimmune retinopathy treatment regimens
Figure 1 Changes in vision, visual field parameters, and electroretinography parameters from the initial visit to the most recent visit in 12 eyes of six patients with non-paraneoplastic autoimmune retinopathy. (A) Changes in LogMAR visual acuity. (B) Mean deviation changes on Humphrey visual field. (C) Pattern standard deviation changes on Humphrey visual field. (D) Changes in scotopic rod response amplitude on Ganzfeld electroretinography. (E) Changes in maximal response a-wave amplitude on Ganzfeld electroretinography. (F) Changes in maximal response b-wave amplitude on Ganzfeld electroretinography. (G) Changes in 30-Hz flicker amplitude on Ganzfeld electroretinography. (H) Changes in 30-Hz flicker implicit time on Ganzfeld electroretinography. The central box shows the 25th–75th percentile. The middle line represents the median. Vertical line extends from the minimum to the maximum. Separate triangles show far out values (larger than the upper quartile plus three times the interquartile range). The solid line connects the median values.
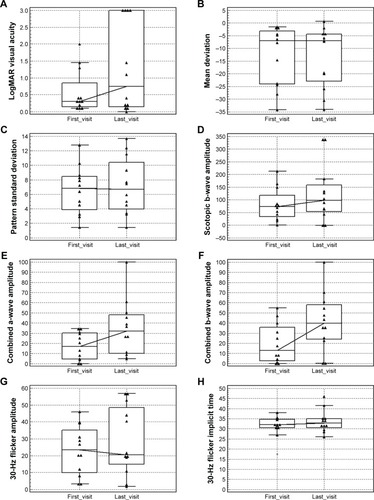
Table 2 Visual acuity, visual field parameters, and electroretinography parameters changes from the initial visit to the most recent visit in patients with non-paraneoplastic autoimmune retinopathy
Figure 2 Changes in visual field parameters (improvement in the mean deviation and stability of pattern standard deviation) in one of the patients from the initial visit before starting rituximab (upper panel) to the last visit (lower panel).
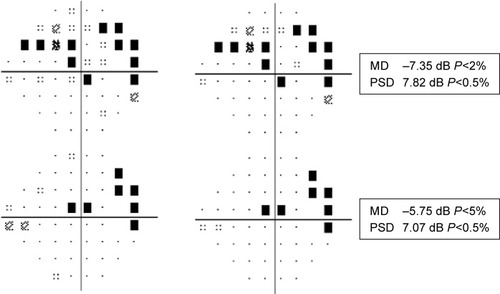
Figure 3 Changes in 30-Hz flicker electroretinography parameters (improvement in the Amp and IT) in one of the patients from the initial visit before starting rituximab (upper panel) to the last visit (lower panel).
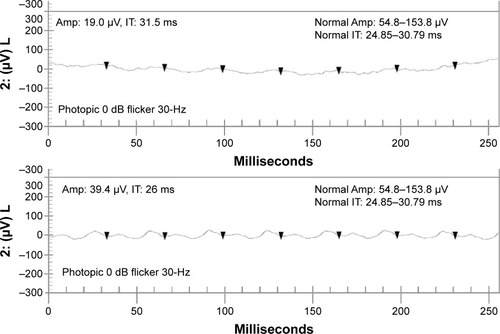
Table 3 Changes in visual acuity, HVF and electroretinography as single tests modalities from the initial visit to the most recent visit in patients with non-paraneoplastic autoimmune retinopathy
Table 4 Anti-retinal and anti-optic nerve autoantibody bands in non-paraneoplastic autoimmune retinopathy