
Figures & data
Figure 1 Definition of positive and negative results at screening.
Note: A positive result was defined as the presence of at least 2 tests outside normal limits.
Abbreviations: IOP, intraocular pressure; HRT, Heidelberg retina tomograph; ONLs, outside normal limits.
Abbreviations: IOP, intraocular pressure; HRT, Heidelberg retina tomograph; ONLs, outside normal limits.
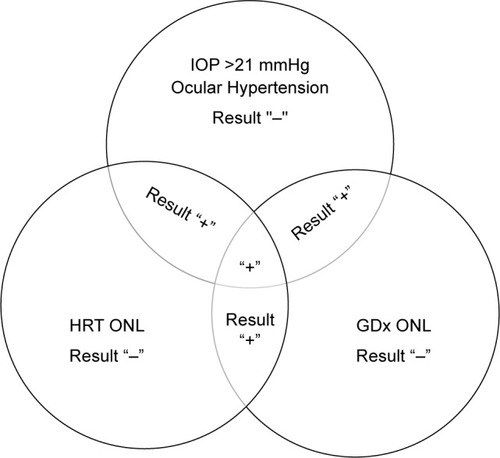
Figure 2 The distribution of subjects with the 2 different detection strategies: conventional detection and telemedicine screening with imaging devices.
Abbreviations: OH, ocular hypertension; PACG, primary closed-angle glaucoma; POAG, primary open angle glaucoma; XFG, pseudoexfoliation glaucoma; PCC, primary care center.
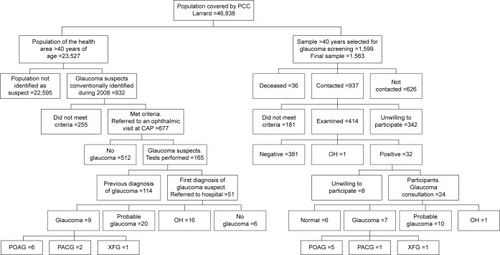
Table 1 Classification criteria
Table 2 Demographics of the participants
Table 3 Degree of glaucoma in detected cases
Table 4 Estimated individual costs
Table 5 Cost of glaucoma screening and conventional detection
Table 6 Detection rate and cost per case detected