
Figures & data
Figure 1 Subject flowchart through 37-month follow-up period.
Abbreviation: LTFU, lost to follow-up.
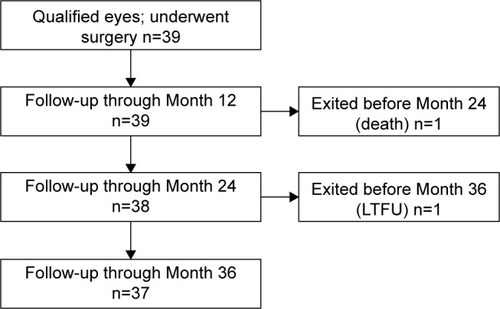
Figure 2 IOP reduction ≥20% versus baseline IOP with reduction of 1 medication.a
Note:
aExcludes IOP after secondary surgery.
Abbreviation: IOP, intraocular pressure.
Abbreviation: IOP, intraocular pressure.
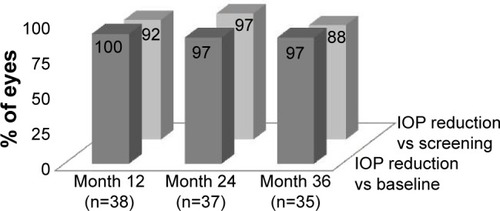
Figure 3 IOP ≤18 mmHg with reduction of 1 medication.a
Note:
aExcludes IOP after secondary surgery.
Abbreviation: IOP, intraocular pressure.
Abbreviation: IOP, intraocular pressure.
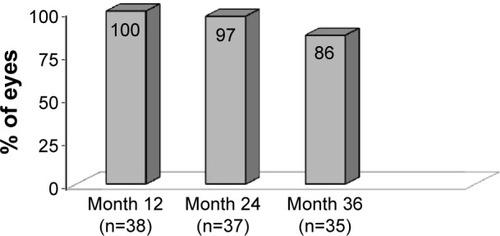
Figure 4 Mean IOP over time.a
Notes:
aExcludes IOP after secondary surgery. bIOP measured after medication washout. cTrabeculectomy for 1 subject at 24 months. dTwo subjects not included in analysis had second medication added at 36 months.
Abbreviations: IOP, intraocular pressure; SD, standard deviation; M, month.
Abbreviations: IOP, intraocular pressure; SD, standard deviation; M, month.
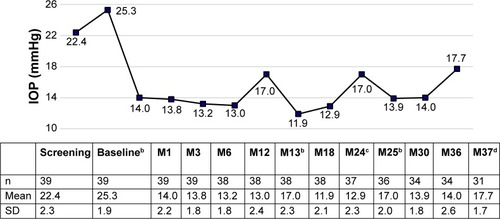
Table 1 Screening and annual postoperative mean C:D ratio, visual field, and central corneal thickness, available eyes at each visit